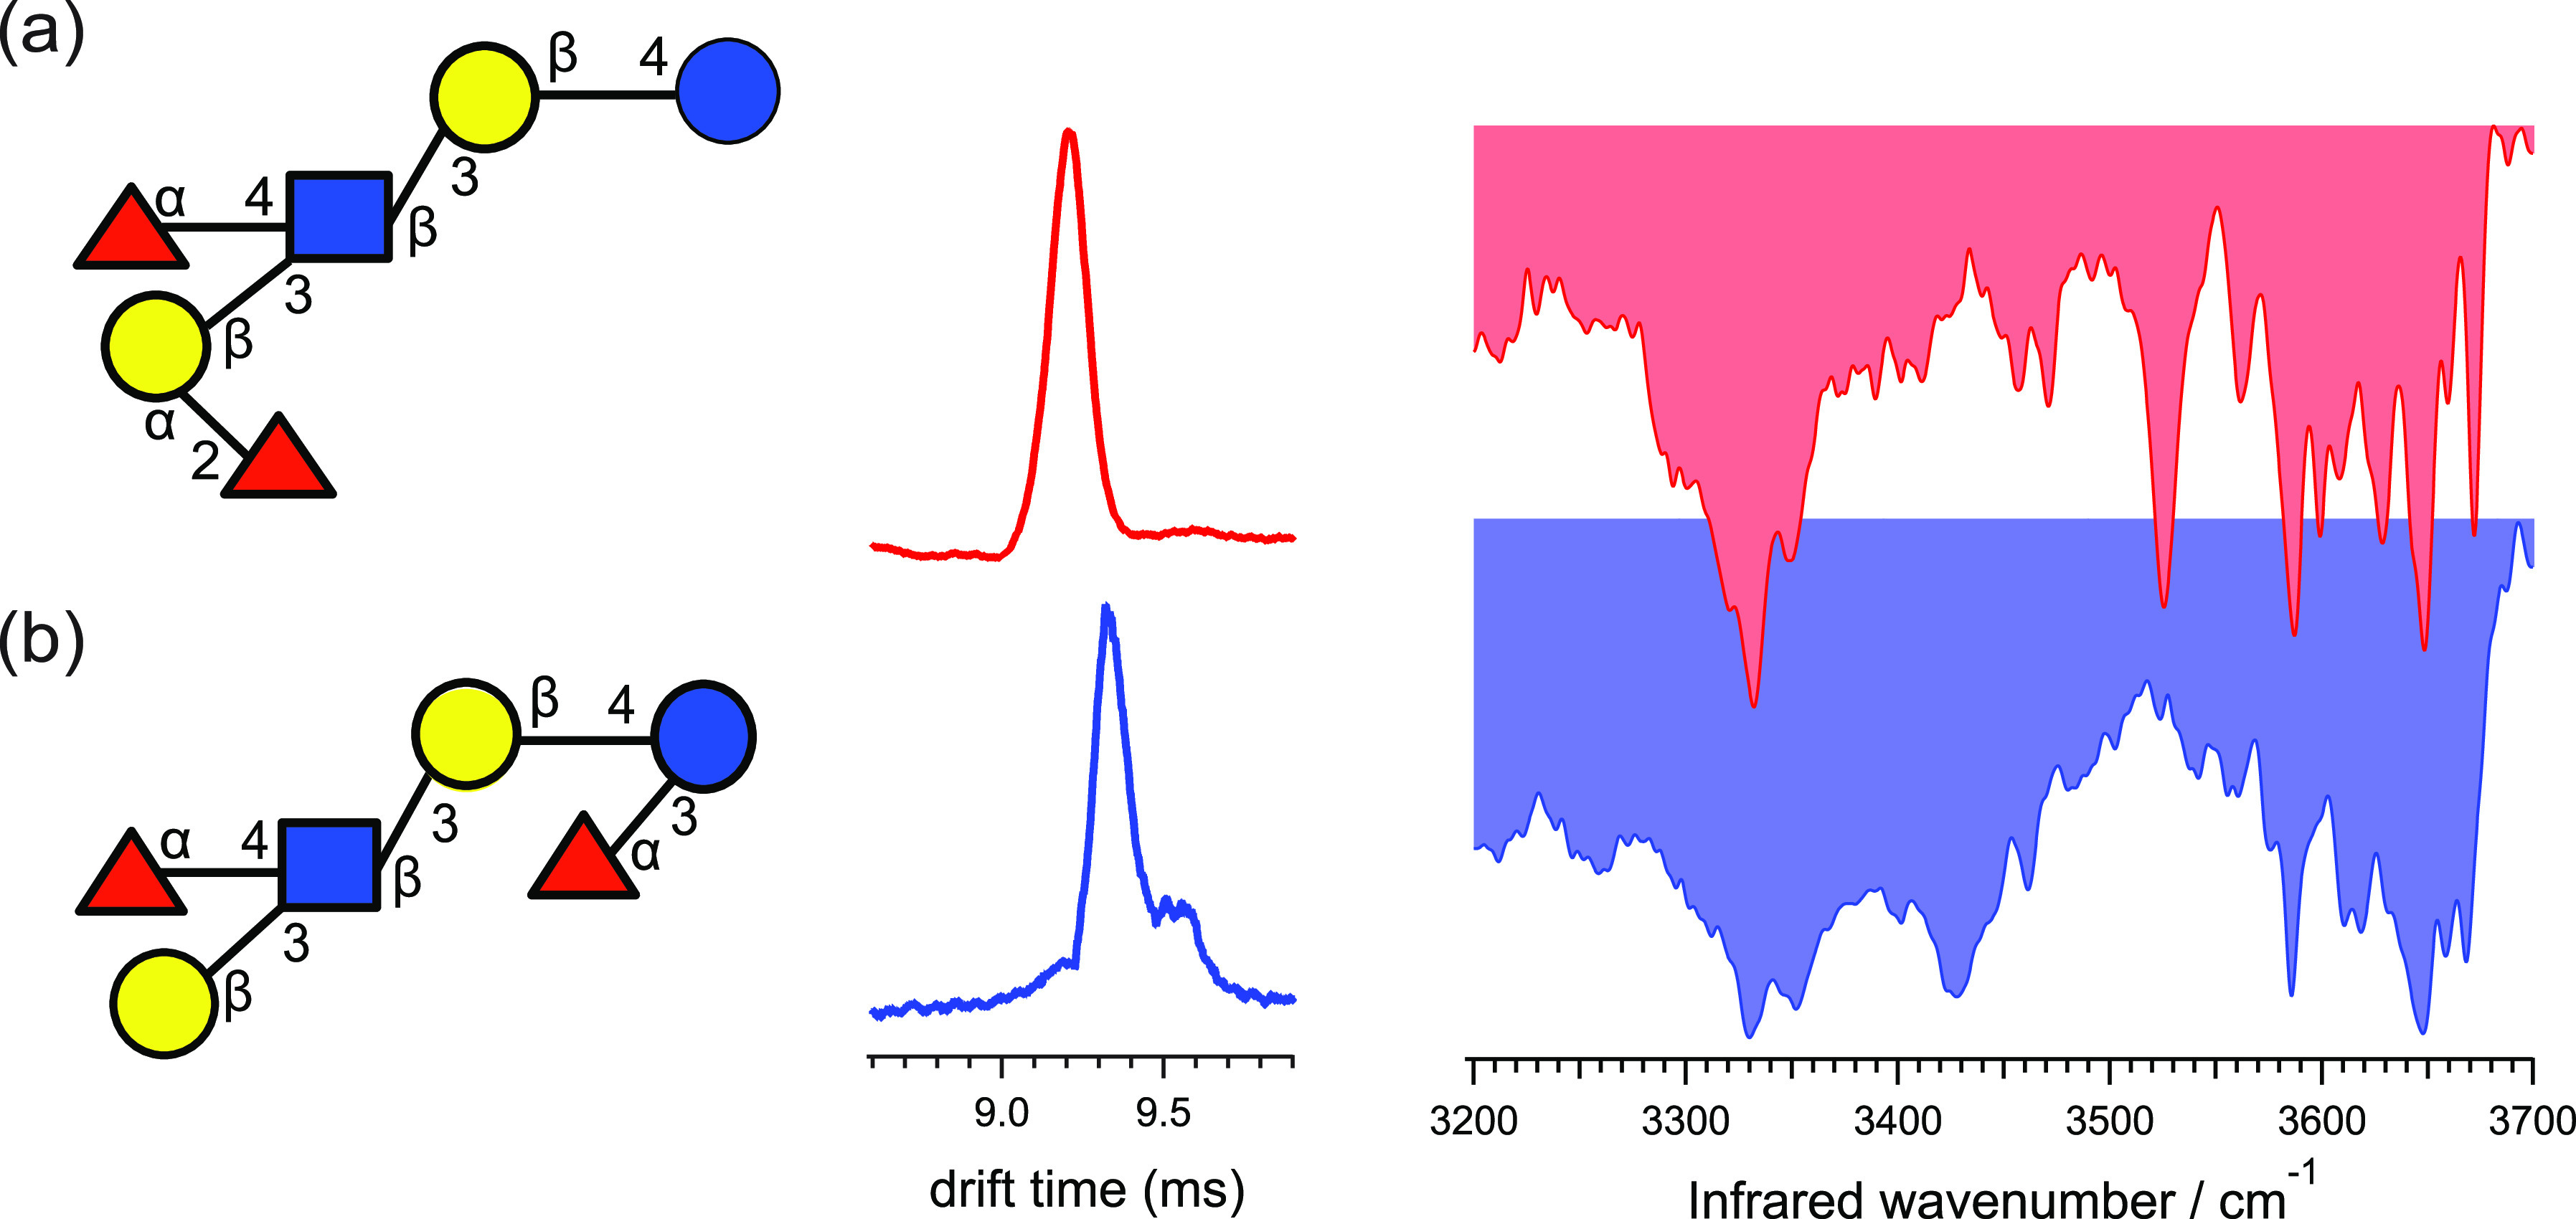
Figure 17.

Gas-phase IR spectroscopy of human milk oligosaccharides. Arrival time distributions and vibrational spectra of sodiated (a) LNDFH I and (b) LNDFH II, each tagged with one molecule of N2. The drift times and peak widths are (a) 9.21 ms, fwhm = 0.13 ms; and (b) 9.32 ms, fwhm = 0.13 ms. Reprinted with permission from ref (292). Copyright 2018 The Royal Society of Chemistry.
