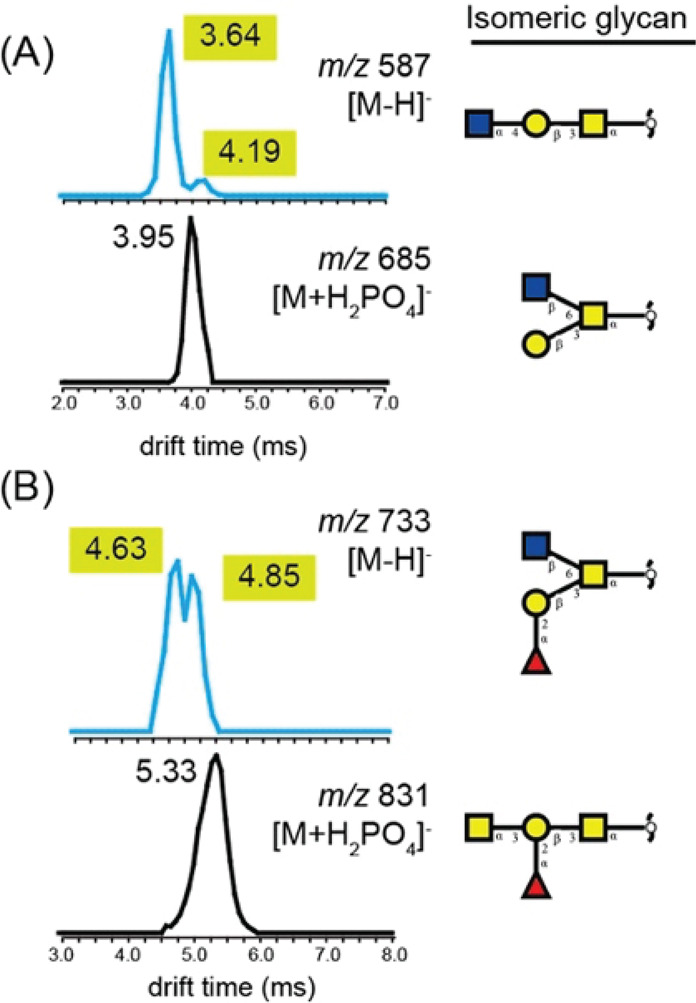
Figure 24.

Ion-mobility-based comparison of two sets of O-glycan isomers as [M – H]– and [M + H2PO4]– ions. (A) Arrival time distributions (ATDs) of two isomers composed of Hex1HexNAc2 measured as deprotonated (m/z 587, blue) or phosphate adduct (m/z 685, black) ions. (B) ATDs of two Hex1HexNAc 2dHex1 isomers as deprotonated (m/z 733, blue) or phosphate adduct (m/z 831, black) ions. Structures are depicted using the symbol nomenclature for glycans (SNFGs): yellow square = GalNAc, yellow circle = Gal, blue square = GlcNAc, red triangle = Fuc. Figure adapted and modified with permission from ref (411). Copyright 2019 American Chemical Society.
