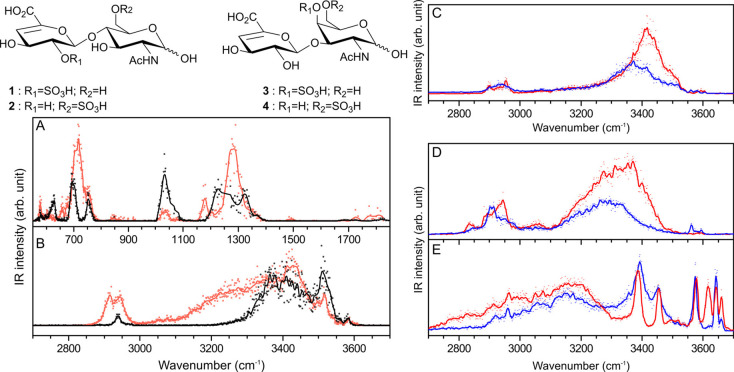
Figure 34.
IRMPD spectra of heparan sulfate (HS) and chondroitin sulfate (CS) disaccharides. Scheme: Δ4,5 unsaturated disaccharides derived from HS (left) and CS (right). (A, B) IRMPD spectra of deprotonated Hp II-A (red: [Hp II-A – H]−) and Hp III-A (black: [Hp III-A – H]−) in the 550–1850 and 2700–3700 cm–1 spectral ranges. Right panels: IRMPD spectra of CS-A (red) and CS-C (blue) in different charge states. (C) Singly deprotonated [CS-A – H]− and [CS-C – H]−. (D) Doubly deprotonated [CS-A – 2H]2– and [CS-C – 2H]2–. (E) NH4+ cationic complexes [CS-A + NH4]+ and [CS-C – NH4]+. Figure reproduced with permission from ref (537). Copyright 2017 American Chemical Society.

