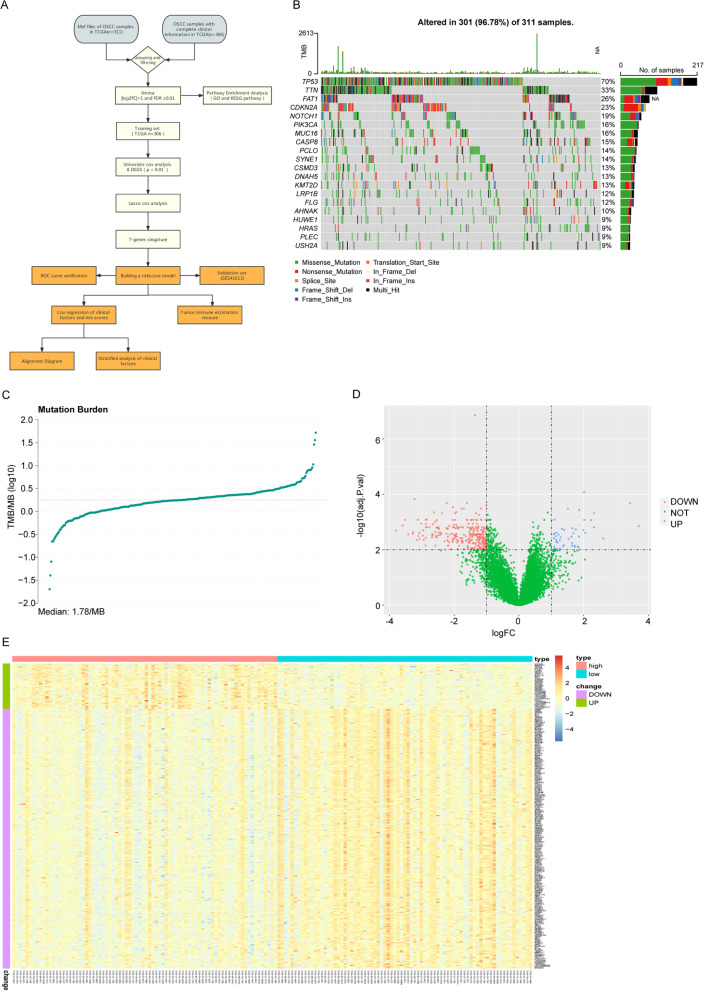
Fig. 1.
Mutation status and differential gene analysis of OSCC in TCGA. A Flow diagram of the study. B Waterfall diagram of the top 20 genes with the highest mutation rate of OSCC in TCGA. C The distribution graph of TMB value. The horizontal coordinate is TMB value and the vertical coordinate is TMB value log base 10. D The volcano diagram of TMB-related genes. The horizontal axis is differentially expressed multiple (Log2FC) and the vertical axis is − log10 (adjusted P value). The blue dots and the red dots represent up-regulation genes and down-regulation genes. E Heatmap of TMB-related genes, the horizontal axis and the vertical axis are the patients and different genes. Red and blue represent high expression and low expression of genes and green and purple represent up-regulated and down-regulated genes

