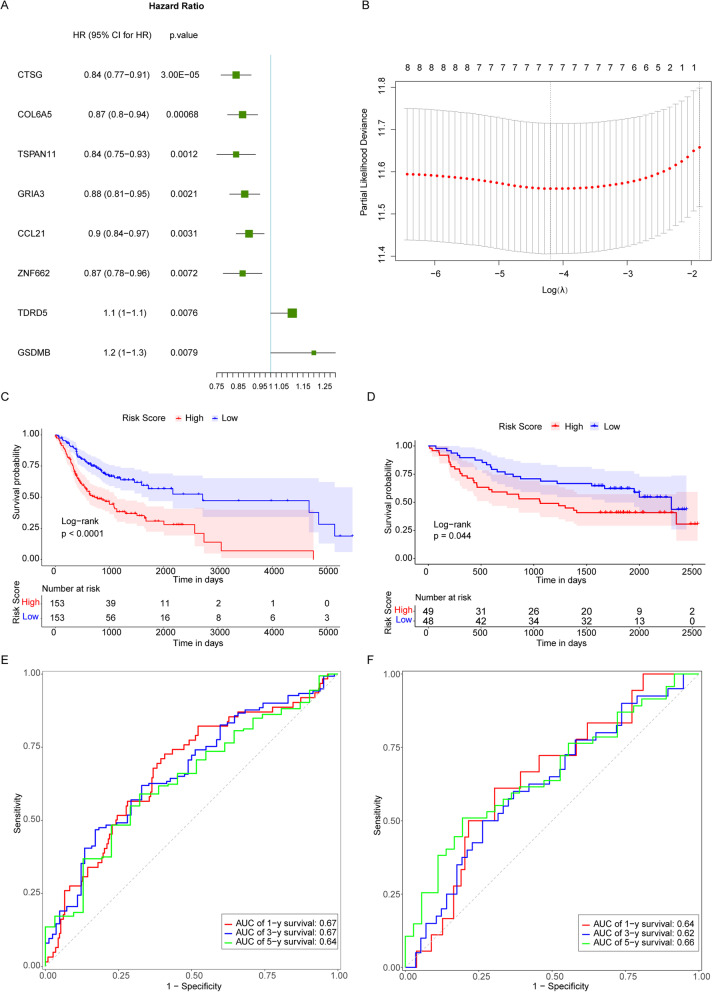
Fig. 3.
Construction of the prognostic model for OSCC. A Univariate analysis forest plot of 8 genes significantly associated with prognosis of OSCC. B A graph of LASSO regression model to determining the tuning parameter lambda. The horizontal axis and the vertical axis are log (lambda) and partial likelihood Deviance. The lambda value corresponding to the minimum value is the best which means the best Lambda value after Log is taken below the dotted line and the number of variables is corresponding to the upper part. C Kaplan–Meier survival curve in TCGA dataset. The horizontal axis and the vertical axis are time and survival rates. Different color represents different groups. P value is based on the log-rank test. D Kaplan–Meier survival curve in GEO dataset. The horizontal axis and the vertical axis are time and survival rates. Different color represents different groups. P value is based on the log-rank test. E Time-dependent ROC curve in TCGA dataset. The horizontal axis is specificity (rate of false alarm; 1-Specificity) and the vertical axis is sensitivity. The area under the ROC curve (AUC) value is used to assess the accuracy of prediction

