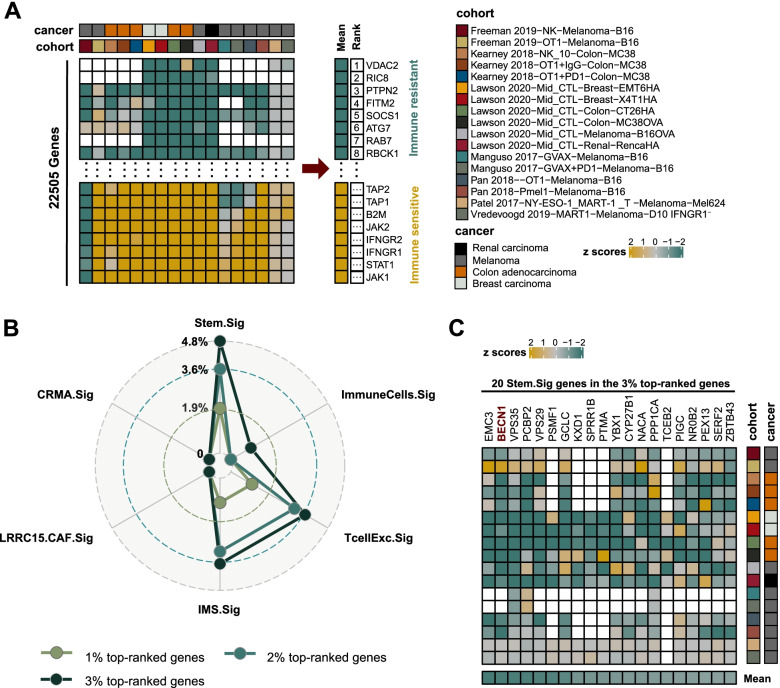
Fig. 6.
Exploration of potential treatment targets from Stem.Sig using CRISPR screening data. A Ranking of genes based on their knockout effects on anti-tumor immunity across 17 CRISPR datasets. Negative (positive) z scores indicated better (worse) immune response after knockout of a specific gene. Genes were ranked according to their mean z scores. Top-ranking genes were associated with immune resistance. Blank squares in the heatmap referred to missing values of gene data from the corresponding cohort. B Radar plot comparing the percentage of top-ranked genes for Stem.Sig and other predictive signatures. C Heatmap depicting z scores of 20 Stem.Sig genes in the 3% top-ranked genes across different CRISPR datasets

