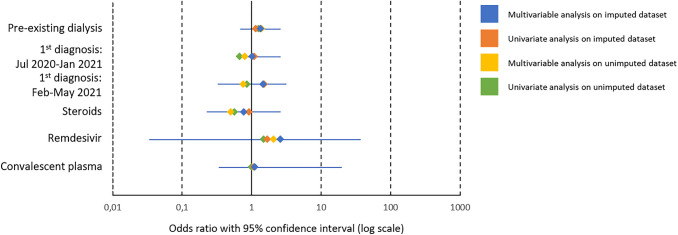
Fig. 3.
Forest plot of odds ratios from conditional regression analyses on fatal outcome stratified by dialysis. Univariate and multivariable regression analyses were performed after propensity-score matching in the imputed and unimputed data sets with the respective (adjusted) odds ratio ((a)OR) displayed in the figure. 95% confidence interval is plotted for the aOR of the multivariable conditional regression of imputed data. Timing of first diagnosis was aggregated into three intervals of pandemic based on the epidemiological waves in Germany: January 2020–June 2020 (reference category), July 2020–January 2021 and February 2021–May 2021. Treatment administered at least once in the course of COVID-19 with no administration serving as reference category

