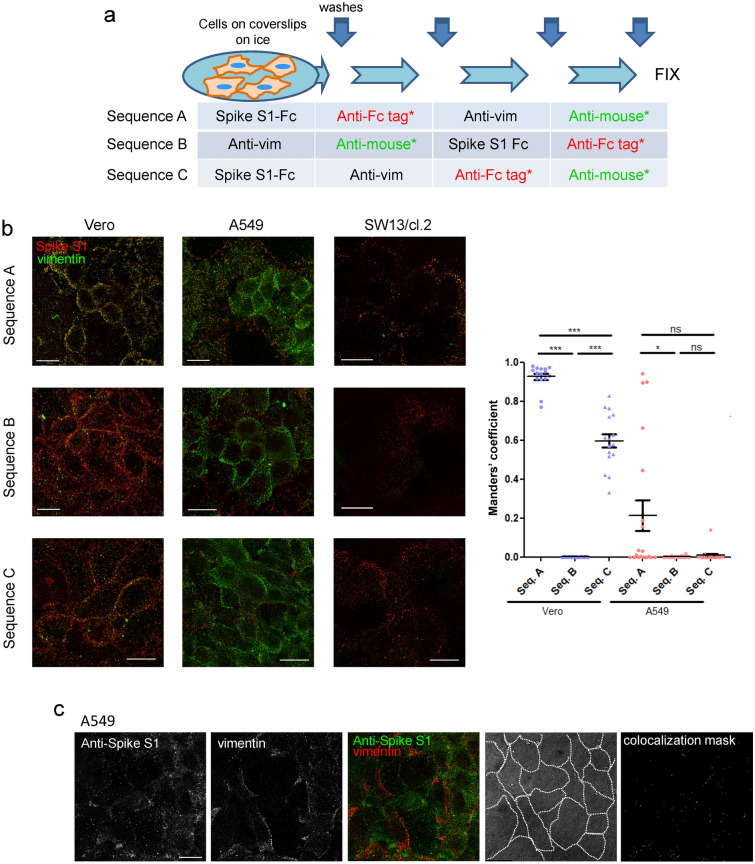
Figure 5.
Detection of Spike S1 and vimentin in several cell types employing different immunodetection sequences. (a) Scheme of the incubation and washing steps performed for immunodetection. Incubations were carried out for 1 h in the cold. After each incubation coverslips were washed three times with 200 μl of cold PBS. At the end of the procedure, an additional washing step with water was performed before coverslips were allowed to dry and mounted. (b) Representative images from the detection of Spike S1-Fc and vimentin in the indicated cell lines following the different immunodetection sequences. The graph shows the colocalization between Spike and vimentin fluorescent signals for Vero and A549 cells with every immunodetection sequence assayed. Colocalization is expressed as the proportion of Spike S1 colocalizing with vimentin signal (Manders’ coefficient), measured applying the automatic Costes’ threshold (n ≥ 12 per condition). Results are shown as mean values ± SEM; ns, non-significant, p > 0.05; *, p ≤ 0.05; **, p ≤ 0.01; ***, p ≤ 0.001 by ANOVA with Tukey’s post-test. (c) A549 cells were incubated with Spike S1-Fc, after which, immunodetection was performed by simultaneous incubation with anti-S1 antibody and 84-1 anti-vimentin monoclonal antibody, followed by simultaneous incubation with the two corresponding secondary antibodies prior to fixation. The bright field image with cell contours highlighted and colocalization mask are shown at the right. Bars, 20 μm.

