Figure 4.
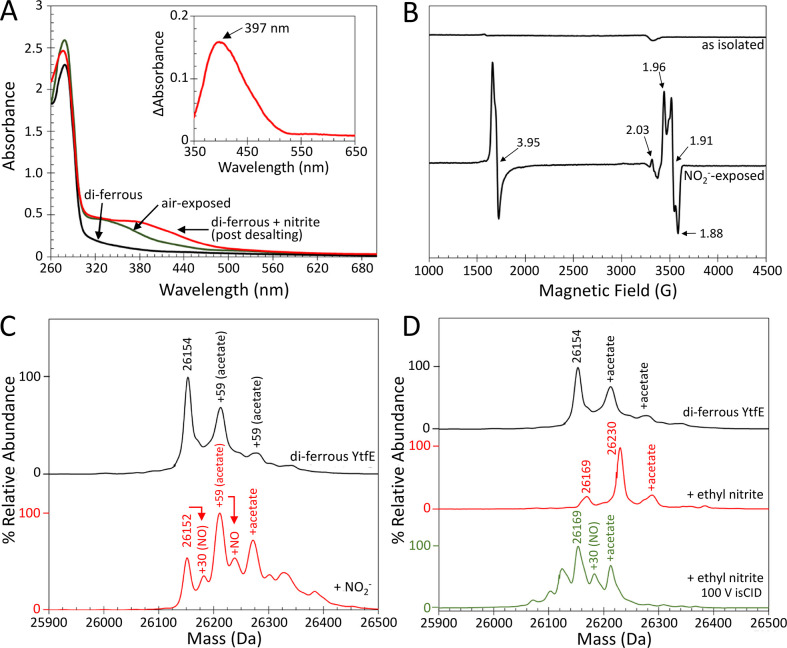
Autonitrosylation of di-ferrous YtfE by nitrite. (A) UV–visible absorbance spectra of di-ferrous YtfE (black line) and nitrite-treated di-ferrous YtfE (red line) post desalting. Air-exposed (mixed-valent/di-ferric) YtfE is shown for comparison (green line). Inset: the difference spectrum between mixed-valent and nitrite-treated YtfE reveals a band at 397 nm, indicative of iron-nitrosyl species. (B) EPR spectra of as-isolated di-ferrous YtfE, pre- and post-treatment with nitrite. Signals arising from MNIC (g = 3.95), DNIC (g = 2.03), and mixed-valent YtfE (g = 1.96, 1.91, and 1.88) are indicated. Note that the EPR spectrum of air-exposed YtfE is shown in Figure 3D. The native mass spectrometry of di-ferrous YtfE treated with (C) nitrite or (D) ethyl nitrite. Nitrosylated YtfE is observed after nitrite, but not ethyl nitrite, treatment. An ethyl nitrite adduct (26,230 Da) was the major species in the latter. A minor peak due to an acetate adduct of the ethyl nitrite adduct was also observed at 26,289 Da. On the low mass side, an oxygen atom (+16 Da) adduct of YtfE was observed at 26,169 Da. The lower spectrum in panel (D) was obtained through in-source collision (isCID), which resulted in the breakdown of ethyl nitrite to give the nitrosylated adduct, along with some unknown lower mass species.

