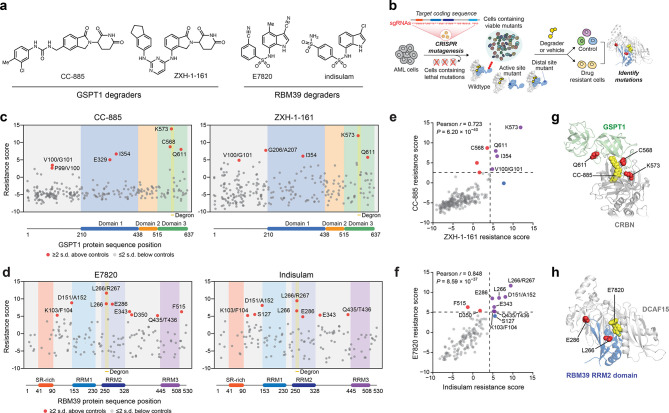
Figure 1.
CRISPR-suppressor scanning identifies regions of GSPT1 and RBM39 that mediate targeted protein degradation by molecular glue degraders. (a) Chemical structures of degraders used in this study. (b) Schematic showing the CRISPR-suppressor scanning workflow applied to molecular glue degraders. (c) Scatter plot showing resistance scores (y axis) in MOLM-13 under CC-885 (left) or ZXH-1-161 (right) treatment at four weeks. Resistance scores were calculated as the log2(fold-change sgRNA enrichment under drug treatment) normalized to the mean of the negative control sgRNAs (n = 22). The GSPT1-targeting sgRNAs (n = 239) are arrayed by amino acid position in the GSPT1 CDS on the x axis corresponding to the position of the predicted cut site. When the sgRNA cut site falls between two amino acids, both amino acids are denoted. Data points represent mean values across three replicate treatments. Protein domains and the structural degron site are demarcated by the colored panels. (d) Scatter plots showing resistance scores (y axis) in MOLM-13 under E7820 (left) or indisulam (right) treatment at four weeks. Resistance scores were calculated as the log2(fold-change sgRNA enrichment under drug treatment) normalized to the mean of the negative control sgRNAs (n = 77). The RBM39-targeting sgRNAs (n = 129) are arrayed by the amino acid position in the RBM39 CDS on the x axis corresponding to the position of the predicted cut site. Data points represent the mean values across three replicate treatments. Protein domains and the structural degron site are demarcated by the colored panels. (e) Scatter plot showing GSPT1-targeting sgRNA resistance scores under CC-885 (y axis) or ZHX-1-161 (x axis) treatment at 4 weeks. Dotted lines represent two s.d. above the mean of the negative control sgRNAs. Pearson’s r and two-sided P values are shown. (f) Scatter plot showing RBM39-targeting sgRNA resistance scores under E7820 (y axis) or indisulam (x axis) treatment at four weeks. Dotted lines represent two s.d. above the mean of the negative control sgRNAs. Pearson’s r and two-sided P values are shown. (g) Structural view of the CC-885-CRBN-GSPT1 ternary complex showing the location of top-enriched sgRNAs (red) (Protein Data Bank (PDB: 5HXB)). (h) Structural view of the E7820-DCAF15-RBM39(RRM2) ternary complex showing the location of top-enriched sgRNAs (red) (PDB: 6UE5).

