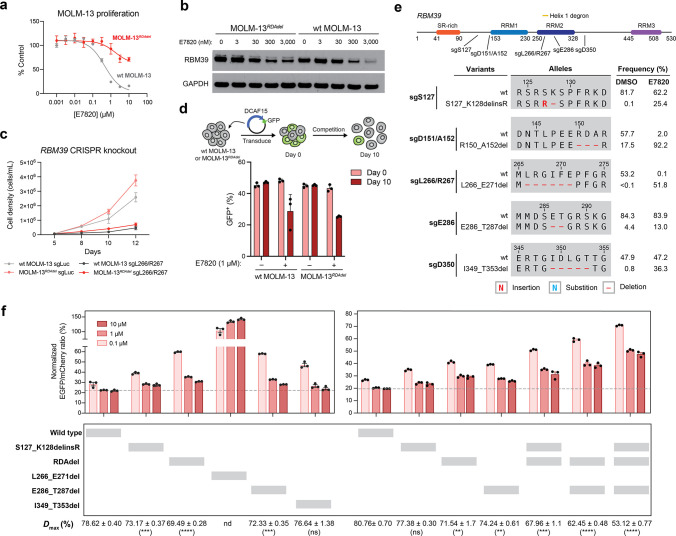
Figure 4.
Mutations distal to the RBM39 RRM2 helix 1 structural degron alter maximum levels of RBM39 degradation to abrogate E7820 cytotoxicity. (a) Dose–response curves for wt MOLM-13 and MOLM-13RDAdel cell proliferation relative to vehicle-treated cells (y axis, % control) after E7820 treatment for 72 h. Data represent mean ± s.e.m. across three technical replicates. One of two independent experiments is shown. (b) Immunoblots showing levels of RBM39 and GAPDH after vehicle or E7820 treatment for 24 h. One of two independent replicates is shown. (c) Line graphs showing cell proliferation (y axis) over a time course (x axis) following lentiviral transduction of SpCas9 and sgRNAs targeting luciferase (sgLuc) or RBM39 (sgL266/R267) into wt MOLM-13 and MOLM-13RDAdel cells. Data represent mean ± s.e.m. across three technical replicates. One of two independent experiments is shown. (d) Bar graphs showing fraction of GFP-positive cells (y axis) in a competition growth assay with nontransduced cells at day 0 and day 10 after treatment with either vehicle or 1 μM E7820 following lentiviral transduction of plasmid overexpressing DCAF15 and GFP in wt MOLM-13 and MOLM-13RDAdel. One of three independent replicates is shown. (e) Schematic showing the coding variants of the most abundant in-frame RBM39 mutations enriched in E7820 treatment (1 μM) by each sgRNA tested. Variant frequencies in vehicle- and E7820-treatment conditions are indicated. (f) Bar plots showing wt and mutant RBM39 cellular protein levels, as indicated by vehicle-normalized EGFP to mCherry ratio (y axis, %), in MOLM-13 cells treated with E7820 for 24 h. Data represent mean ± s.e.m. across three technical replicates. Dotted gray line indicates the mean signal of wt MOLM-13 treated with 10 μM E7820. Values for Dmax ± s.e.m. are shown (right) with significance levels from a two-sided Student’s t-test comparing to wt RBM39 Dmax indicated in parentheses (P < 10–3: ***; P < 10–4: ****; ns: not significant; nd: not determined). One of two independent experiments is shown. Full dose–response curves are shown in Figure S5d.

