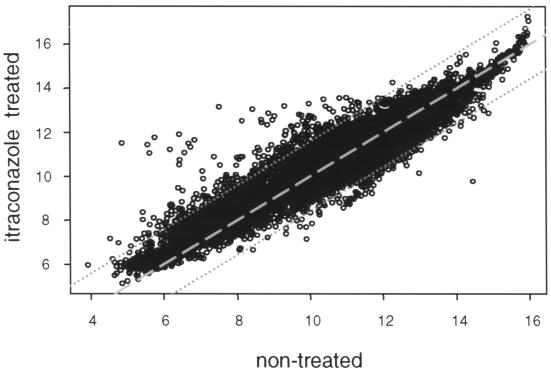
FIG. 1.
Correlation graph. Normalized hybridization signals from one representative experiment from Cy5 (untreated wild-type C. albicans cells) and Cy3 (itraconazole-treated C. albicans cells) channels were plotted against each other on a logarithmic scale. The data series have a correlation coefficient of 0.93. Datum points with differential expression less than 2.5-fold fall between the two dotted lines. The dashed line is the perfect diagonal.

