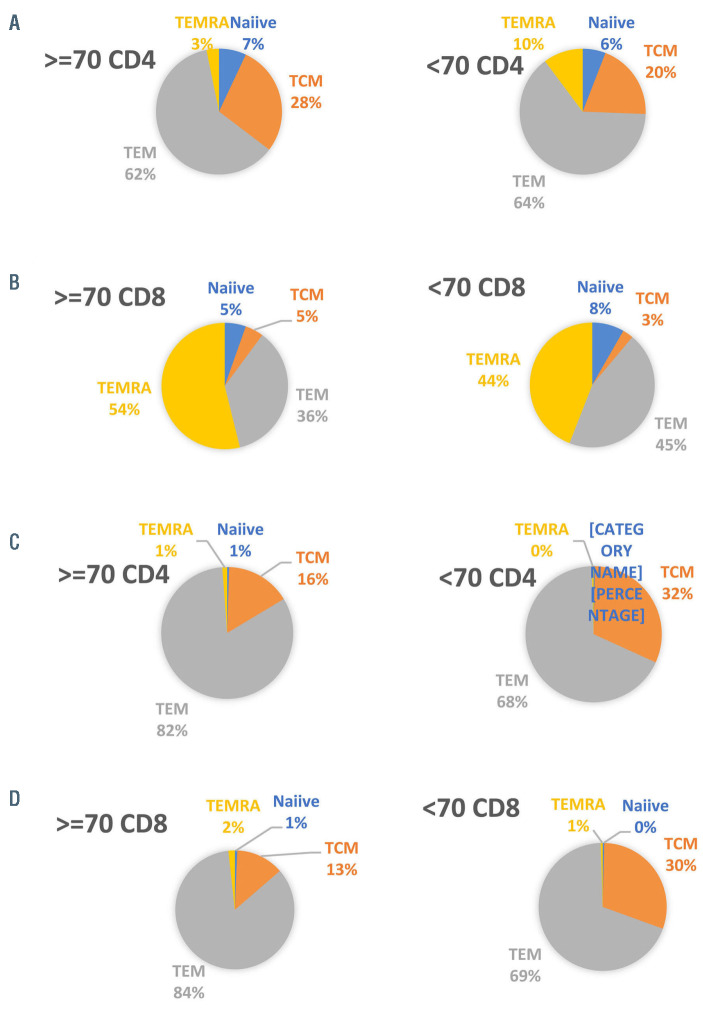
Figure 1.
Subpopulations of T cells in the apheresis and in the CAR-T cell therapy product from a portion of the study group (n=19) and control group (n=16). (A) Subpopulations of CD4 T cells in apheresis product; (B) subpopulations of CD8 T cells in apheresis product; (C) subpopulations of CD4 T cells in the CAR-T cell therapy product; (D) subpopulations of CD8 T cells in the CAR-T cell therapy product.

