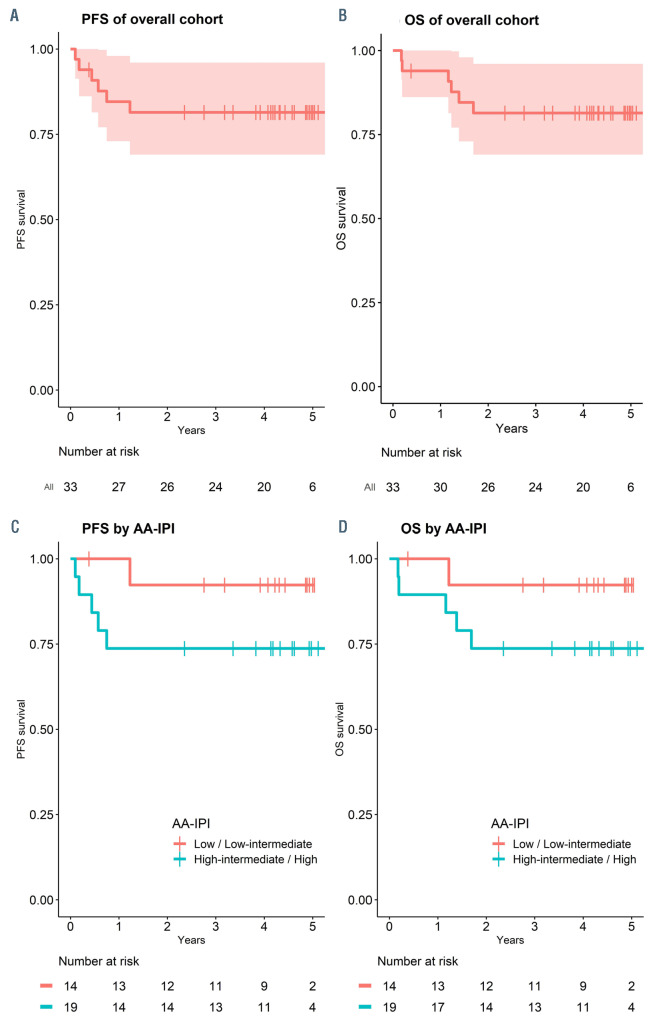
Figure 2.
Survival outcomes. (A) Kaplan-Meier sur vival estimate of progression- free survival (PFS) (red-line with shaded area denoted 95% confidence interval). Life table is listed below. (B) Kaplan- Meier survival estimate of overall survival (OS) (redline with shaded area denoted 95% confidence inter val). Life table is listed below. (C) Kaplan-Meier sur vival estimate of PFS by AA-IPI (red-line denoted low/low-intermediate and blue-line denoted highintermediate/ high categories). Life table is listed below. (D) Kaplan-Meier survival estimate of OS by AA-IPI (red-line denoted low/low-intermediate and blue-line denoted highintermediate/ high categories). Life table is listed below.

