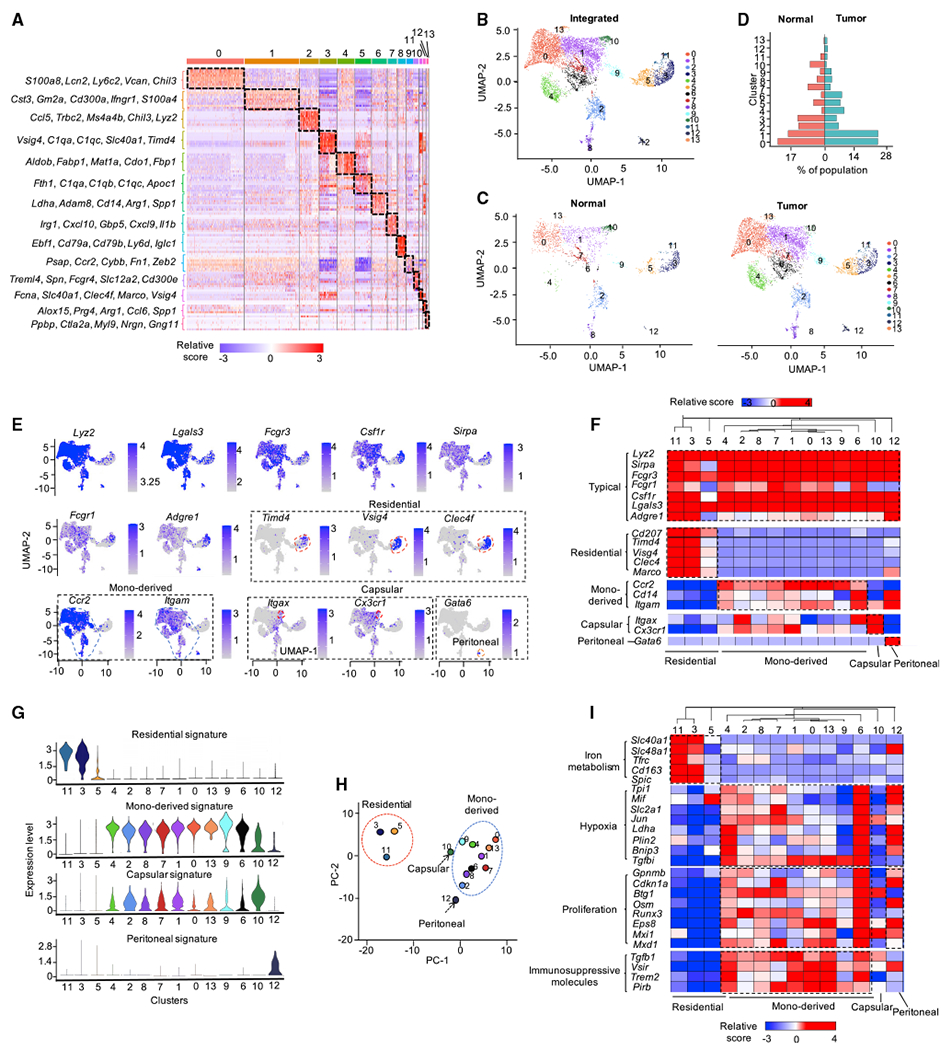
Figure 1. Heterogeneity of TAMs within the liver TME.

(A) Gene expression heatmap of 14 macrophage clusters.
(B and C) UMAP visualization of integrated (B) and split projections (C) from tumor and normal sample, color-coded based on the clusters; each dot represents a single cell.
(D) Proportions of each macrophage cluster in tumor and normal sample.
(E) UMAP showing the expression levels of 14 selected marker genes for macrophages; expression levels are color-coded as gray: not expressed and blue: expressed.
(F) Heatmap visualization of the expression of markers for typical macrophages, Kupffer cells, MDMs, LCMs, and PMs.
(G) Violin plots showing the enrichment of gene signatures of Kupffer cells, MDMs, LCMs and PMs in macrophages, determined by multiple features analysis of Seurat v. 3.
(H) Principal-component analysis (PCA) for 14 macrophage clusters for all marker genes in each cluster. Averaged position of all cells in each cluster were represented; dots are colored by Seurat cluster, as shown in (B).
(I) Heatmap showing the expression level of iron metabolism-, hypoxia-, proliferation-related genes and T-cell-co-inhibitory molecules in Kupffer cells, MDMs, LCMs, and PMs; color of each heatmap cell represents the relative expression level of each gene (Z score).
