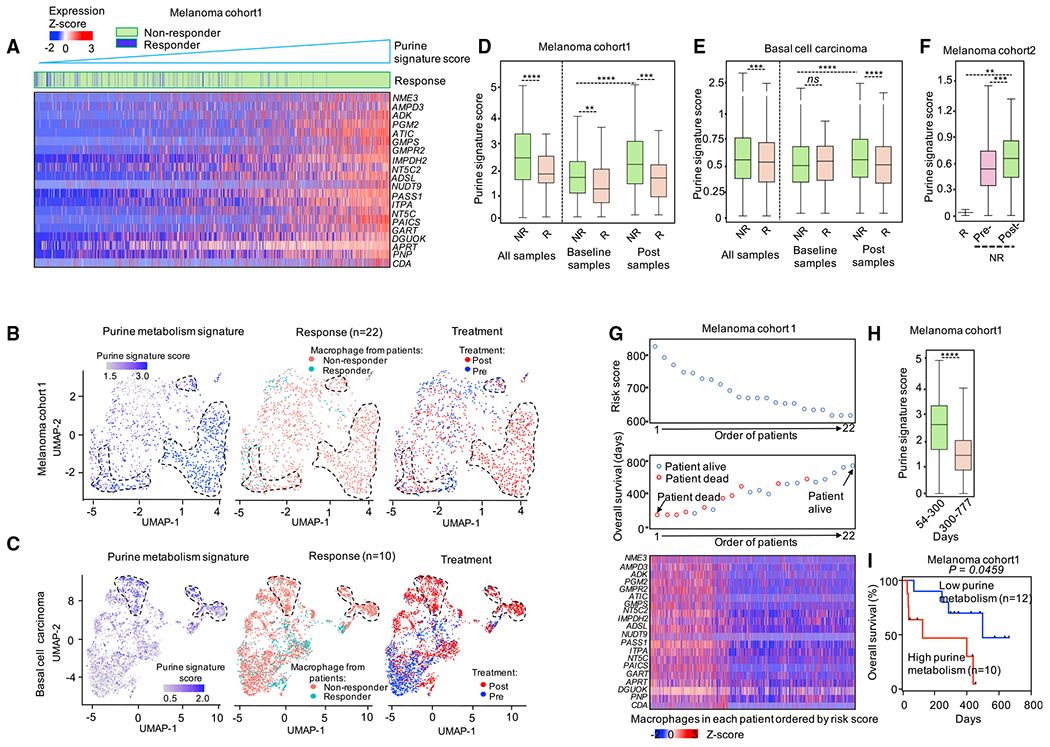
Figure 7. Purine metabolic TAMs were associated with clinical outcome.

(A) Heatmap showing the expression level of purine metabolic genes in macrophages from patients with melanoma (Sade-Feldman et al., 2018). Macrophages were ordered by the score of purine metabolic gene signature. Macrophages were labeled (the “Response” row) by their origins; green: macrophage from ICB non-responders; blue: macrophage from ICB responders.
(B and C) UMAP plots showing the clusters of macrophages from melanoma cohort 1 (Sade-Feldman et al., 2018) (B) and basal cell carcinoma cohort (C). Cells were colored by the score of purine metabolic gene signature, ICB response of patients, and samples the macrophages were isolated from, respectively.
(D–F) The expression level of purine metabolic genes in macrophages from ICB responders and non-responders over three cohorts (Jerby-Arnon et al., 2018; Sade-Feldman et al., 2018; Yost et al., 2019). The thick line represents the median value, the bottom and top of the boxes are the 25th and 75th percentiles (interquartile range). Whiskers encompass 1.5 times the interquartile range. Mann-Whitney test was used to calculate the significance between two groups; *p < 0.05, **p < 0.01, and ***p < 0.001.
(G) The impact of expression of purine metabolic genes in macrophages on overall survival (OS) in melanoma patients. Upper: the ranked risk score of 22 melanoma patients evaluated by the coefficient of purine metabolic genes. Middle: the OS distribution of the 22 patients ranked according to the risk score (from upper). Bottom: heatmap of the expression pattern of purine metabolic genes in the macrophages from the 22 melanoma patients.
(H) The expression level of purine metabolic genes in macrophages from patients with melanoma. Macrophages were grouped by the OS time of corresponding patients. Mann-Whitney test was used to calculate the significance between two groups; *p < 0.05, **p < 0.01, and ***p < 0.001.
(I) Kaplan–Meier plots of OS for 22 melanoma patients accept ICB therapy (Sade-Feldman et al., 2018). Patients were stratified into low and high purine metabolism groups with the median of the purine metabolism score in macrophages from corresponding melanoma patients. Cox proportional hazards model was used to test the OS difference between low and high group.
