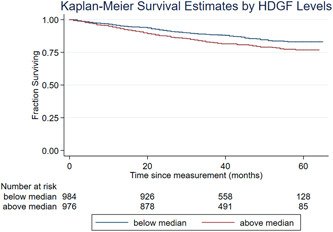
Figure 2.

Kaplan–Meier survival curve for hepatoma‐derived growth factor (HDGF) in pulmonary arterial hypertension (PAH)‐Biobank cohort. The curve represents survival analysis of PAH‐Biobank cohort dichotomized by median serum HDGF (n = 2017, p = 0.001) levels
