Figure 1.

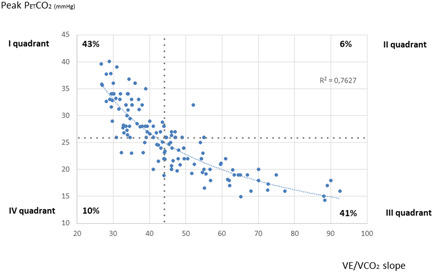
Scatterplot of VE/VCO2 slope versus peak PETCO2. PETCO2, end‐tidal carbon dioxide pressure; VE/VCO2 slope, ventilation to carbon dioxide production slope

Scatterplot of VE/VCO2 slope versus peak PETCO2. PETCO2, end‐tidal carbon dioxide pressure; VE/VCO2 slope, ventilation to carbon dioxide production slope