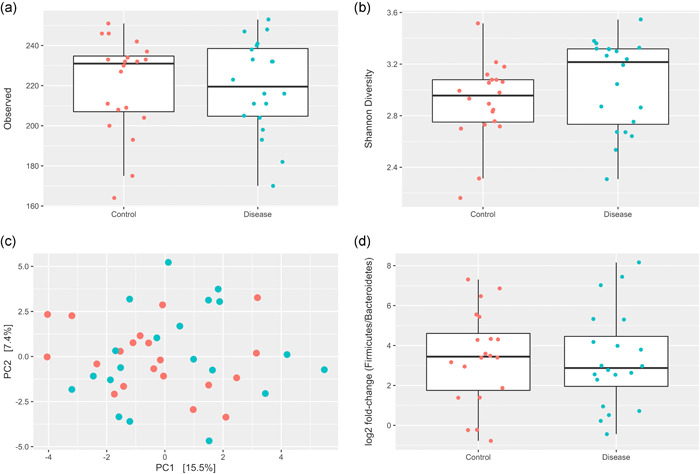
Figure 2.

Intestinal microbiota diversity measures between groups. (a) Distribution of observed species read counts. (b) Alpha Diversity (Shannon Index) between PAH and non‐PAH control groups. (c) Beta diversity principal component plot between PAH and non‐PAH control groups. (d) Firmicutes/bacteriodetes ratio between PAH and non‐PAH control groups. PAH, pulmonary arterial hypertension
