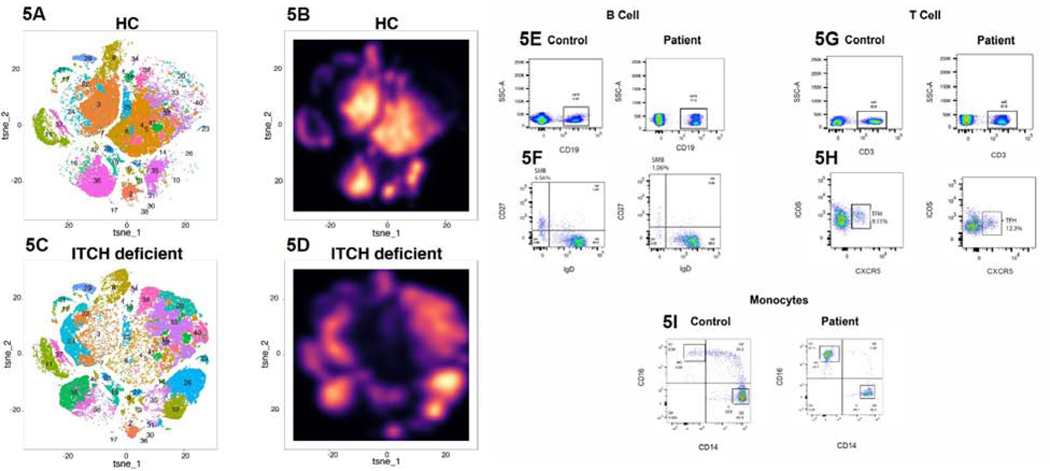
Figure 5: Immunophenotyping of ITCH Deficiency.
CyTOF performed on PBMCs from healthy control and ITCH-deficient patient demonstrated significant alterations in immunophenotype on a global scale (5A–5D). In 5A and 5C, clusters are displayed as dot plots,with individual coloration and numbering for each cluster (detailed in Table E2). In 5B and 5D, clusters are displayed as amplitude of cell counts (or “galaxy plots”). Flow cytometry studies demonstrated quantitatively normal B cells (5E), low switched-memory B cells (5F), mildly decreased T cells (5G), elevated T follicular helper cells (5H), low total monocytes, increased non-classical monocytes and decreased classical monocytes (5I).

