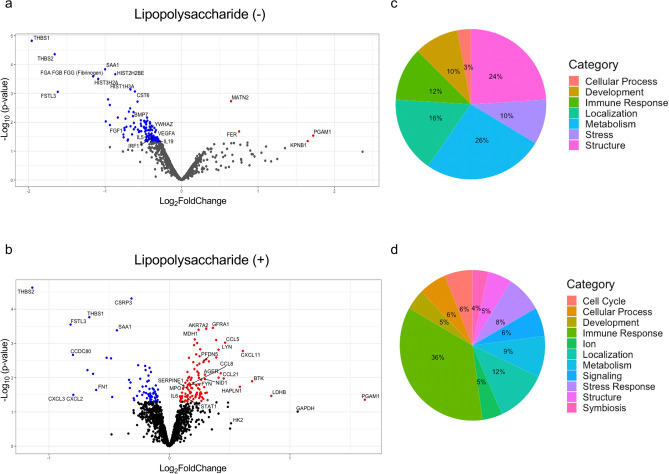
Figure 1.
Regional proteomics and processes in the absence or presence of LPS. (a) Volcano plot for the condition of LPS(−) showing proteins mostly had less abundance in atelectatic than in aerated lung. (b) Volcano plot for the condition of LPS(+) presenting mostly increased proteins in atelectasis. Red dots represent significant proteins with increased fold-change in atelectasis compared to aerated lung; and blue for significant proteins decreased in atelectasis. (c, d) Categorical breakdown of processes in conditions of LPS(−) (c) or LPS(+) (d). LPS lipopolysaccharide.

