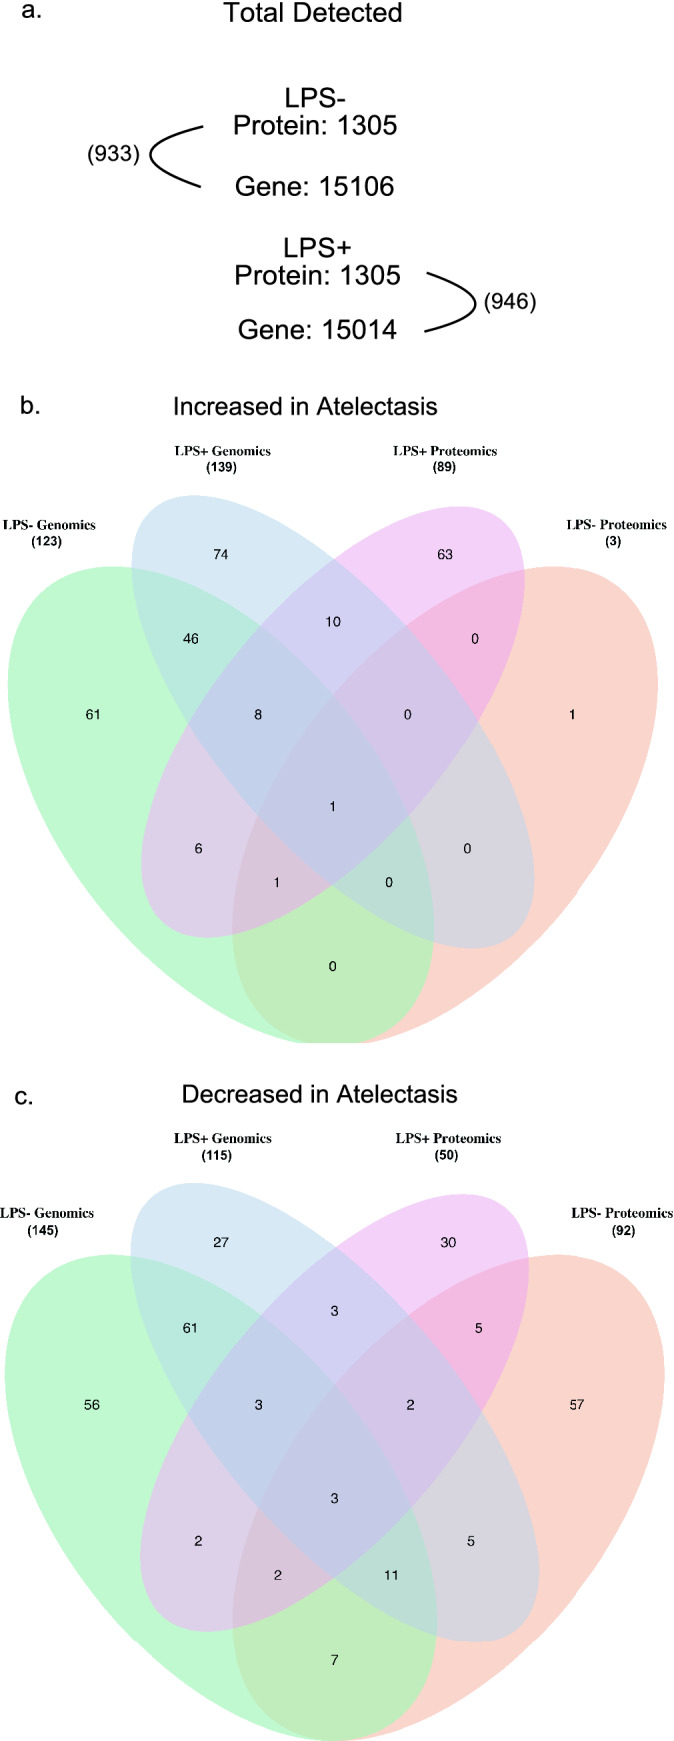
Figure 4.

Overlap of genes and proteins in transcriptomics and proteomics. (a) The numbers of total detected proteins and genes in LPS(−) or LPS(+) conditions and the numbers in parentheses indicating the possible overlap between proteomics and transcriptomics. (b, c) Venn diagram showing the overlap of significantly increased (b) or decreased (c) gene/protein pairs in atelectatic relative to aerated lung in both transcriptomics and proteomics. In parenthesis, the total significant genes or proteins detected based on directionality of magnitude (increased or decreased) are displayed. LPS lipopolysaccharide.
