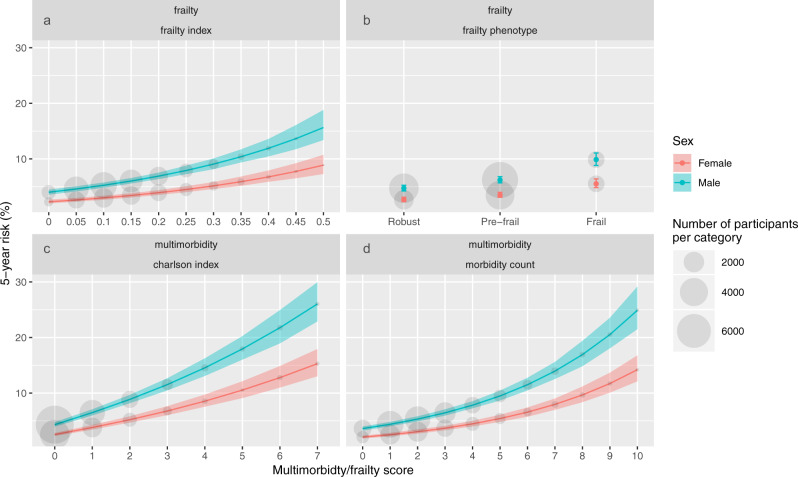
Fig. 3. Relationship between frailty or multimorbidity and all-cause mortality.
This figure shows the predicted 5-year mortality rate for each measure of frailty or multimorbidity (panel (a) frailty index, (b) frailty phenotype, (c) Charlson index, (d) long-term condition count). Coloured lines or points indicate point estimates for predicted 5-year mortality. Men are shown in blue, and women in red. Shaded areas indicate 95% confidence intervals. Grey circles indicate the number of participants with each level of frailty or multimorbidity. Models are adjusted for age, sex, socioeconomic status, body mass index, smoking, and alcohol. Predicted 5-year mortality is based on age 60, socioeconomic status and body mass index held at the sample mean, previous smokers, and 1–4 times weekly alcohol intake.

