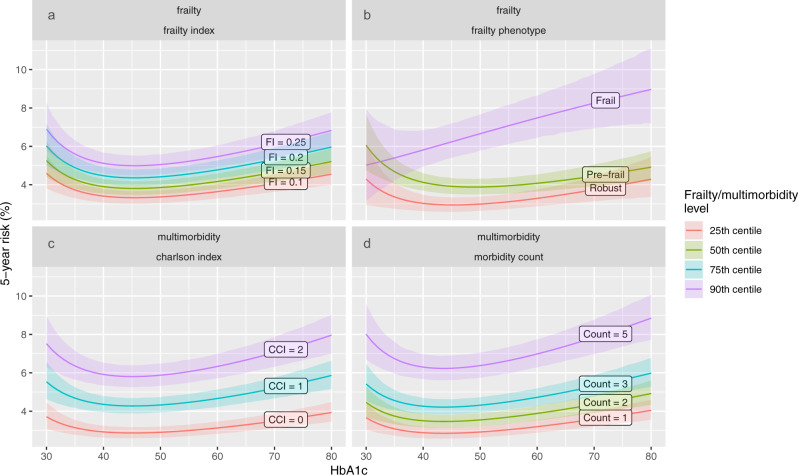
Fig. 5. HbA1c and all-cause mortality.
This figure shows the relationship between HbA1c and predicted 5-year mortality at different levels of frailty or multimorbidity (panel (a) frailty index, (b) frailty phenotype, (c) Charlson index, (d) long-term condition count). Coloured lines or points indicate point estimates for predicted 5-year mortality. Colours indicate the level of frailty or multimorbidity according to centiles. Shaded areas indicate 95% confidence intervals. Models are adjusted for age, sex, socioeconomic status, body mass index, smoking, and alcohol. Predicted 5-year mortality is based on age 60, socioeconomic status, and body mass index held at the sample mean, previous smokers, and 1–4 times weekly. There was a significant interaction between the frailty phenotype and HbA1c. Interactions between frailty index, Charlson index, and LTC count were not significant.

