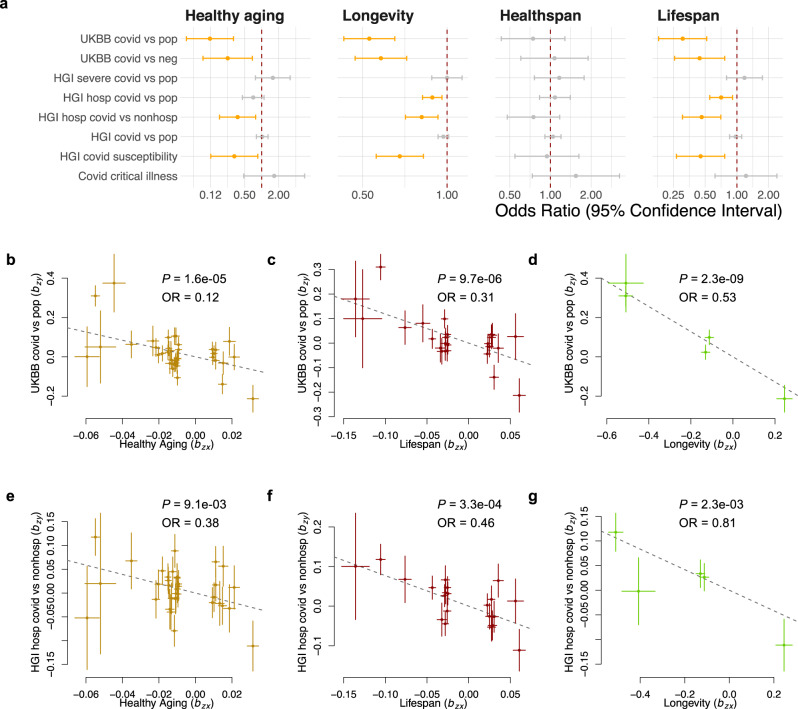
Fig. 1. Mendelian randomization analysis reveals an association of lifespan-related traits with the risk of COVID-19.
a Forest plot shows Mendelian randomization estimates for the causal effect of lifespan-related traits on the risk of COVID-19. Error bars show 95% confidential interval. Significant effects with FDR < 0.05 are in orange. Nominally significant effects (P < 0.05) are in black. Plots of effect sizes of all genetic instruments from GWAS for healthy aging (b), lifespan (c), and longevity (d) (x-axis) versus those for UKBB COVID-19 (y-axis); and the same set of exposure traits (e−g) (x-axis) versus HGI COVID-19 hospitalization (y-axis). Error bars represent standard errors. UKBB UK Biobank, HGI Host Genetics Initiative, pop population control, OR Odds Ratio.

