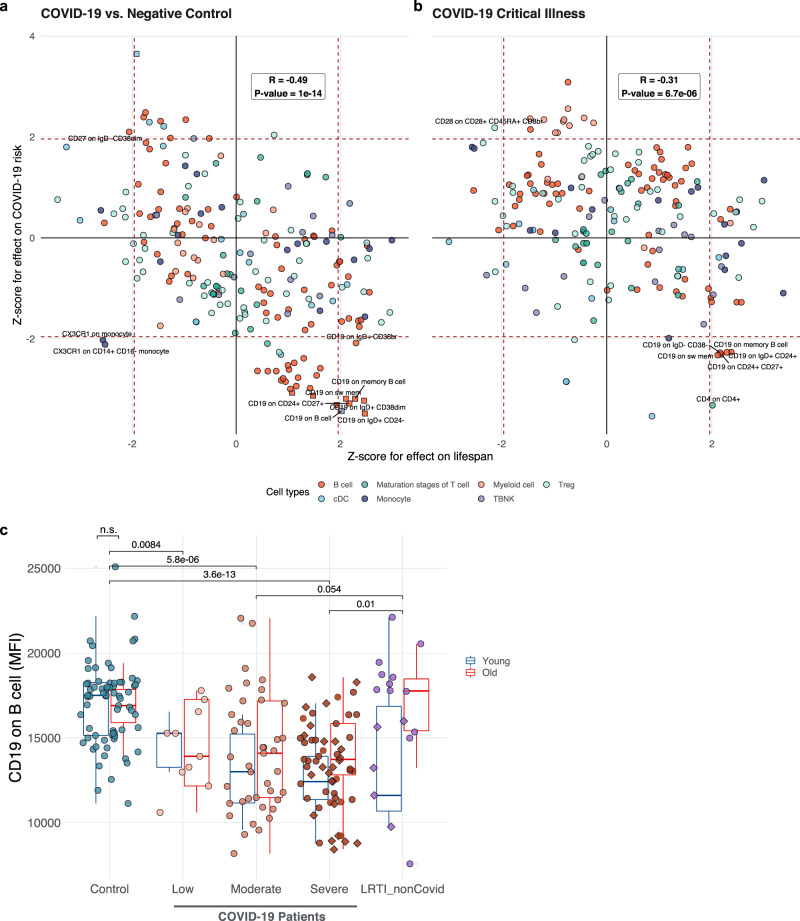
Fig. 4. Mendelian randomization on 389 immune cell-type-specific surface markers and analysis of clinical data reveal the role of CD19 in B cells.
Mendelian randomization results showing the effect of immune cell surface marker levels on lifespan (x-axis), and the y-axis shows the Z-score for the risk of COVID-19 infection (Ntrait = 389) (a) and COVID-19 critical illness (b). Red dashed lines to denote the ±1.96 Z-score threshold (equivalent to P < 0.05). Only traits with P < 0.05 for both outcomes are annotated. Traits with FDR < 0.05 for at least one outcome are shown in squares. c Box plot showing the CD19 level in B cells in different groups (Ncontrol = 70, Nlow = 10, Nmoderate = 41, Nsevere = 58, NLRT = 17). Blue boxes represent younger subjects (age < 60) and the red boxes older subjects (age > 60). Subjects that have been admitted to ICU are in the diamond. The center line in the box shows the median. The bottom and top of the box show the 25th and 75th quantiles. The whiskers represent the expected variation of the data. The whiskers extend 1.5 times the IQR from the top and bottom of the box. cDC classical dendritic cells, TBNK T cells B cells and natural killer cells, MFI median fluorescence intensities, LRT lower respiratory tract infections.

