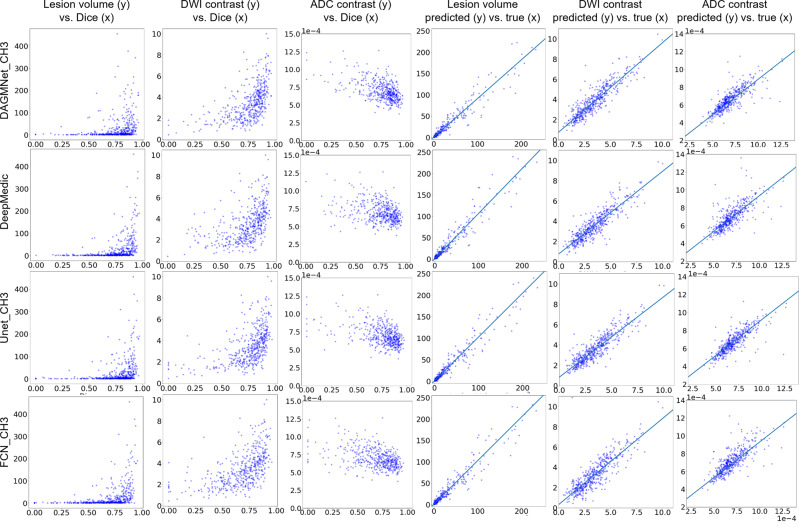
Fig. 6. Correlation between lesion features and segmentation performance, and correlation between lesion features as segmented manually or automatically.
The first three columns are scatter plots of lesion features (volume, DWI, and ADC contrast) versus Dice score of the different models (rows) in the Testing dataset (n = 459). They show how the models perform in lesions of diverse volume and contrast. The last three columns are the metrics of volume, DWI, and ADC of the lesions as traced by human evaluators (“true”) vs. as predicted by the different models (rows). Volumes are in ml. ADC values are in 1e − 4 mm2/s. Spearman’s correlation coefficient and 95% CI are in Table 2. The DWI contrast metrics are defined in “Methods”.

