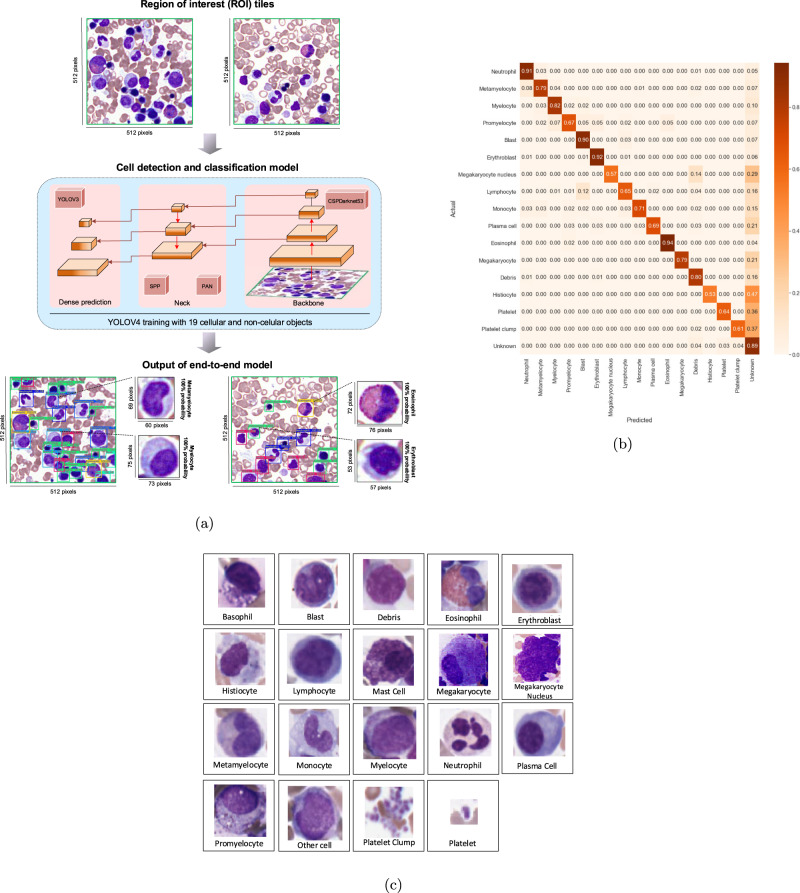
Fig. 3. Applying the YOLO model to localize objects in selected region of interest (ROI) tiles.
a Example of a Region of Interest (ROI) tile, as the output of the ROI detection model, the You-Only-Look-Once (YOLO) cell detection and classification model architecture, and output examples of applying the YOLO model to detect and classify objects inside the input ROI tiles. b The cross-validation confusion matrix showing the performance of the YOLO cell detection and classification model applied on 16 different cytological and non-cytological object types representing 10 diagnostic categories. Each value represents the percentage of classification per object type across others. Rows indicate the ground-truth object class while columns display the object type predicted by the model. The diagonal values indicate the true positive portion for each object type and the other values, outside of the diagonal, display the misclassification rates. c Thumbnail images of 19 samples for cellular objects and non-cellular objects for cell detection and classification model.

