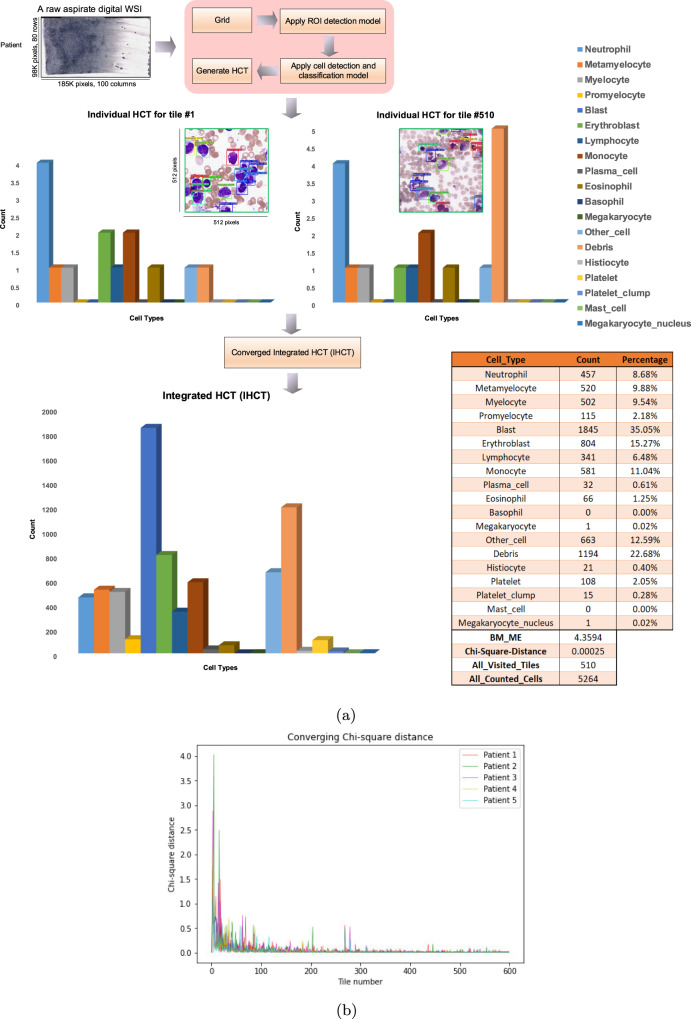
Fig. 5. Generating the Histogram of Cell Types (HCT) and converged Integrated Histogram of Cell Types.
a Each histogram of cell types (HCT) is created individually for each Region of Interest (ROI) tile. The Integrated HCT (IHCT) is then updated as successive ROI histogram are accumulated. This process is stopped once the IHCT is converged using the Chi-square (χ2) distance. Collective cytological information from a patient bone marrow aspirate is then represented as an IHCT and a table with summary statistics such as the number of each cell type, percentage, BMME ratio and Chi-Square distance. b Variation of the Chi-square distance through visiting and analyzing selected ROI tiles by the architecture and how an IHCT is converged by processing each tile. For five samples of patients, the IHCT is converged after visiting a number of tiles in the range of 400 to 500 tiles.

