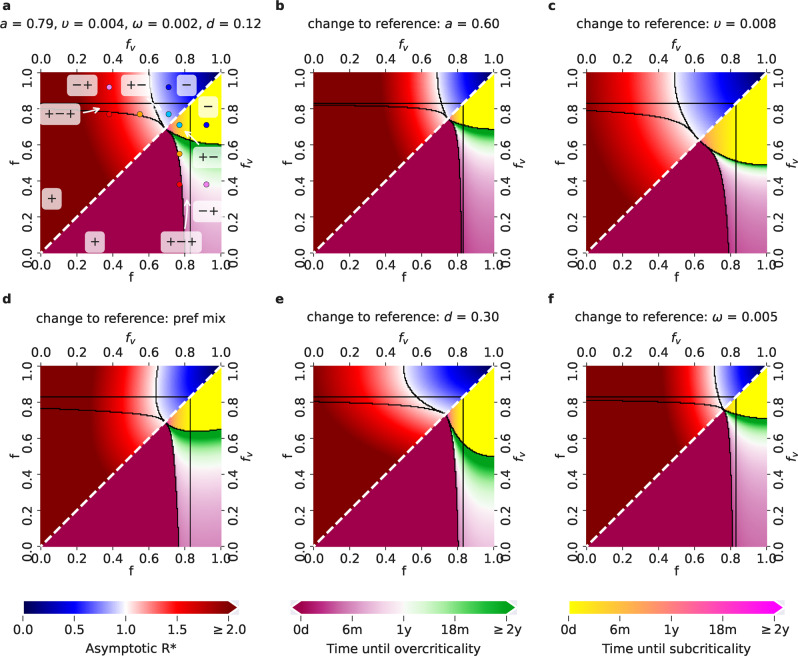
Fig. 2. Possible COVID-19 epidemic dynamics for different parameter setups for the Delta variant.
The relevant f − fv parameter space, where fv ≤ f, can be divided into five regions (delimited by black borders), each associated with a different behavior of the epidemics. On the diagonal (white dashed line), f = fv, i.e., the restrictions for VP holders and for the rest of the population are the same - corresponding to the situation when VPs are not introduced at all. Lower triangles show the time until the last critical threshold: different color scales correspond to the time until the switch either from a subcritical to an overcritical epidemic (time until overcriticality, violet-green scale), or from an overcritical to a subcritical epidemic (time until subcriticality, yellow-pink scale). Upper triangles show the asymptotic , as a function of the values of f and fv (blue-red scale, with blue associated with and red associated with ). a Reference setup, with a = 0.79 (corresponding to the effectiveness of the Comirnaty vaccine on the Delta variant), υ = υr = 0.004, ω = 0.002, d = 0.12 (fraction of never-vaccinated in the United Kingdom) and proportional mixing. The choices of (f, fv) corresponding to the five scenarios exemplified in Fig. 1c are denoted by points of the same color. b Setup with a decreased vaccine effectiveness: a = 0.6 (corresponding to the effectiveness of the Vaxzevria vaccine on the Delta variant). c Setup with an increased vaccination rate: υ = υr = 0.008. d Setup with preferential (instead of proportional) mixing. e Setup with an increased fraction of people who will not get vaccinated: d = 0.3 (fraction of never-vaccinated in France). f Setup with an increased waning rate: ω = 1/200.

