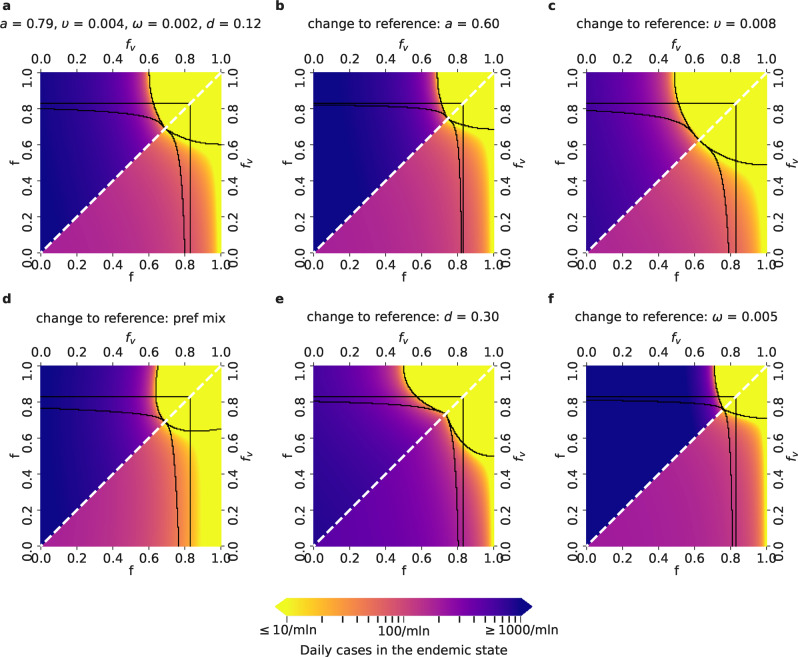
Fig. 3. Daily COVID-19 infection cases in the endemic state for different parameter setups and the Delta variant.
Lower triangles show the daily infection numbers in the vaccinated, and upper triangles in the unvaccinated population in the endemic state of the epidemics, for the relevant f − fv parameter space, where fv ≤ f. The color scale spans from no more than 10 (yellow) up to 1000 and more daily cases per million people (dark violet). Parameter setups as well as the black borders that delimit the five regions are defined as in Fig. 2: a Reference setup, with a = 0.79 (corresponding to the effectiveness of the Comirnaty vaccine on the Delta variant), υ = υr = 0.004, ω = 0.002, d = 0.12 (fraction of never-vaccinated in the United Kingdom) and proportional mixing. b Setup with a decreased vaccine effectiveness: a = 0.6 (corresponding to the effectiveness of the Vaxzevria vaccine on the Delta variant). c Setup with an increased vaccination rate: υ = υr = 0.008. d Setup with preferential (instead of proportional) mixing. e Setup with an increased fraction of people who will not get vaccinated: d = 0.3 (fraction of never-vaccinated in France). f Setup with an increased waning rate: ω = 1/200.

