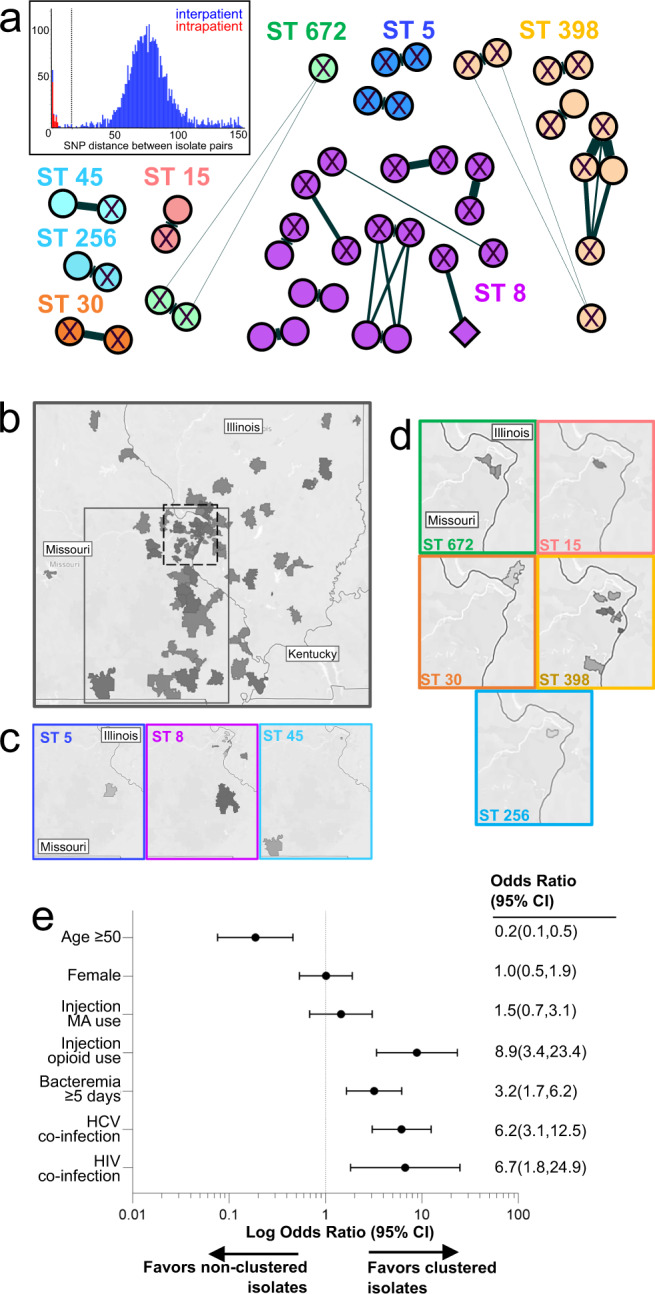
Fig. 4. Clonal outbreaks of diverse lineages among persons who inject drugs.

a Networks of isolates with ≤15 core genome SNPs. Each node represents one of 46 index isolates, and are color coded by MLST, shaped according to whether associated with IDU-BSI (circle) or non-IDU BSI (diamond), and labeled according to HCV serostatus (‘X’ denotes HCV co-infection). Edge length and width represent SNP distance between nodes. Inset, histogram depicting collective core genome SNP distances between isolate pairs obtained from separate patients (“interpatient”, blue) or from the same patient (“intrapatient”, red). For clarity only comparisons with <150 SNPs are displayed. Dotted line denotes the 15 SNP cutoff used to define clonal relationship between isolates. b–d Heat maps of BSI patients’ zip code of residence for all isolates (panel b), or for isolates included in panel a (panels c, d). In panel b, areas denoted by dashed or gray lines are magnified in panels c and d, respectively. e Odds ratio comparting the characteristics between isolates included in panel a (“clustered) and all other isolates in the cohort (“non-clustered”). MA, methamphetamine.
