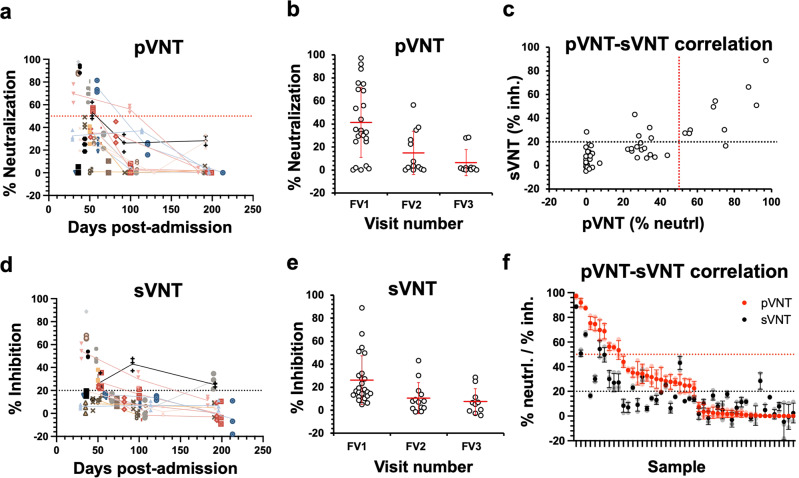
Fig. 3. Comparison of COVID-19 neutralizing antibodies (NAb) status from convalescents samples between pseudovirus neutralization test (pVNT) and surrogate virus neutralization test (sVNT) methods.
Evaluation of NAb status from COVID-19 convalescent samples at different time points post infection from different follow up visits (FV) using (a, b) pVNT and (d, e) sVNT. Data shown in (a, d) were mean ± standard deviation (SD) of % neutralization for pVNT and mean ± SD% inhibition for sVNT, respectively. Each data points were performed in triplicates. Lines connecting different data points represented samples that were obtained from the same subjected collected at different time points. Data shown in (b, e) were mean values of % neutralization for pVNT and % inhibition for sVNT from different samples. c Correlation between sVNT and pVNT. Mean values from each data point were represented on the graph. f Alternative correlation plot between sVNT and pVNT where data were arranged from highest to lowest values of pVNT neutralization percentages. Data were represented as mean ± SD. Red and black dotted lines represent cut-off values at 50% and 20% for pVNT and sVNT, respectively, to distinguish positive and negative NAb status.

