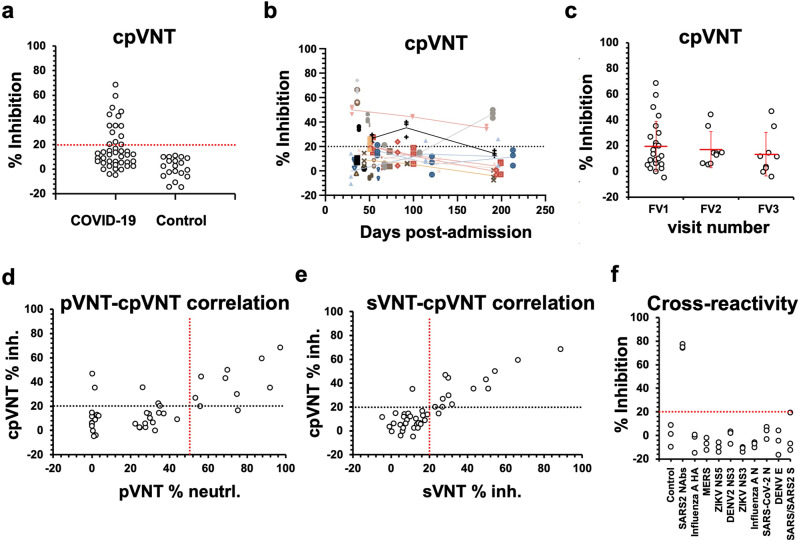
Fig. 4. Evaluation of neutralizing antibodies (NAb) status from COVID-19 convalescent samples, at different time points post infection, from different follow up visits (FV) using cellulose pull-down virus neutralization test (cpVNT).
a NAbs from all samples and visits as compared to pre-COVID plasma samples. Cut-off value which distinguished positive from negative NAb levels was designated at 20% inhibitory percentage (red line). Each data point represented mean value of % inhibition of different samples. Each point was performed in triplicates. b NAbs detection using cpVNP from different samples at different time points. Data were represented as mean ± standard deviation (SD). Each data point was performed in triplicates. Lines connecting different data points represented signals obtained from the same sample at different time points. c Alternative presentation of NAbs detected from different visits. Each data point represented mean value of % inhibition obtained from different samples. Each point was performed in triplicates. d Correlation between cpVNT and pseudovirus neutralization test (pVNT). Black and red lines represent cut-off values at 20% and 50% for cpVNT and pVNT, respectively. Each data point represented mean value of % inhibition or % neutralization for cpVNT and pVNT, respectively. Each point was performed in triplicates. e Correlation between cpVNT and surrogate virus neutralization test (sVNT). Black and red lines represent cut-off values at 20% for cpVNT and pVNT. Each data point represented mean value of % inhibitions for cpVNT and pVNT. Each point was performed in triplicates. f Cross reactivity test of cpVNT using antibodies against different viruses or viral antigens spiked in healthy plasma samples. Red line represents a cut-off value at 20%. Each data point represented % inhibition from a single cpVNT experiment. Three separate experiments were performed for each condition.

