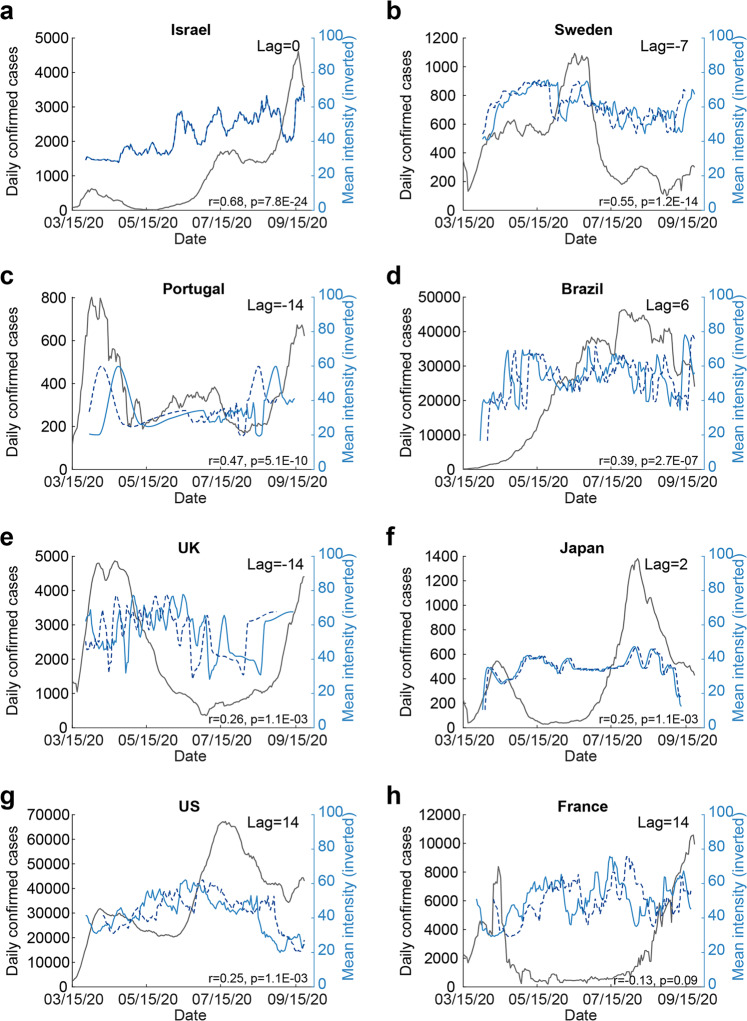
Fig. 3. Odorant intensity estimates correlated with national COVID-19 infection rates over time.
a The correlation between intensity estimates and national levels of COVID-in Israel. Blue line: mean daily additive inverse intensity ratings. Dashed blue line: shifted additive inverse intensity time-series, after finding the peak lag using cross correlation (see “Methods” section). Black line: number of daily confirmed cases in each country. Note that when the lag is close to zero, then the dashed and solid blue lines align and overlap. All other panels the same as a but for: b Sweden. c Portugal. d Brazil. e United Kingdom. f Japan. g United States. h France.

