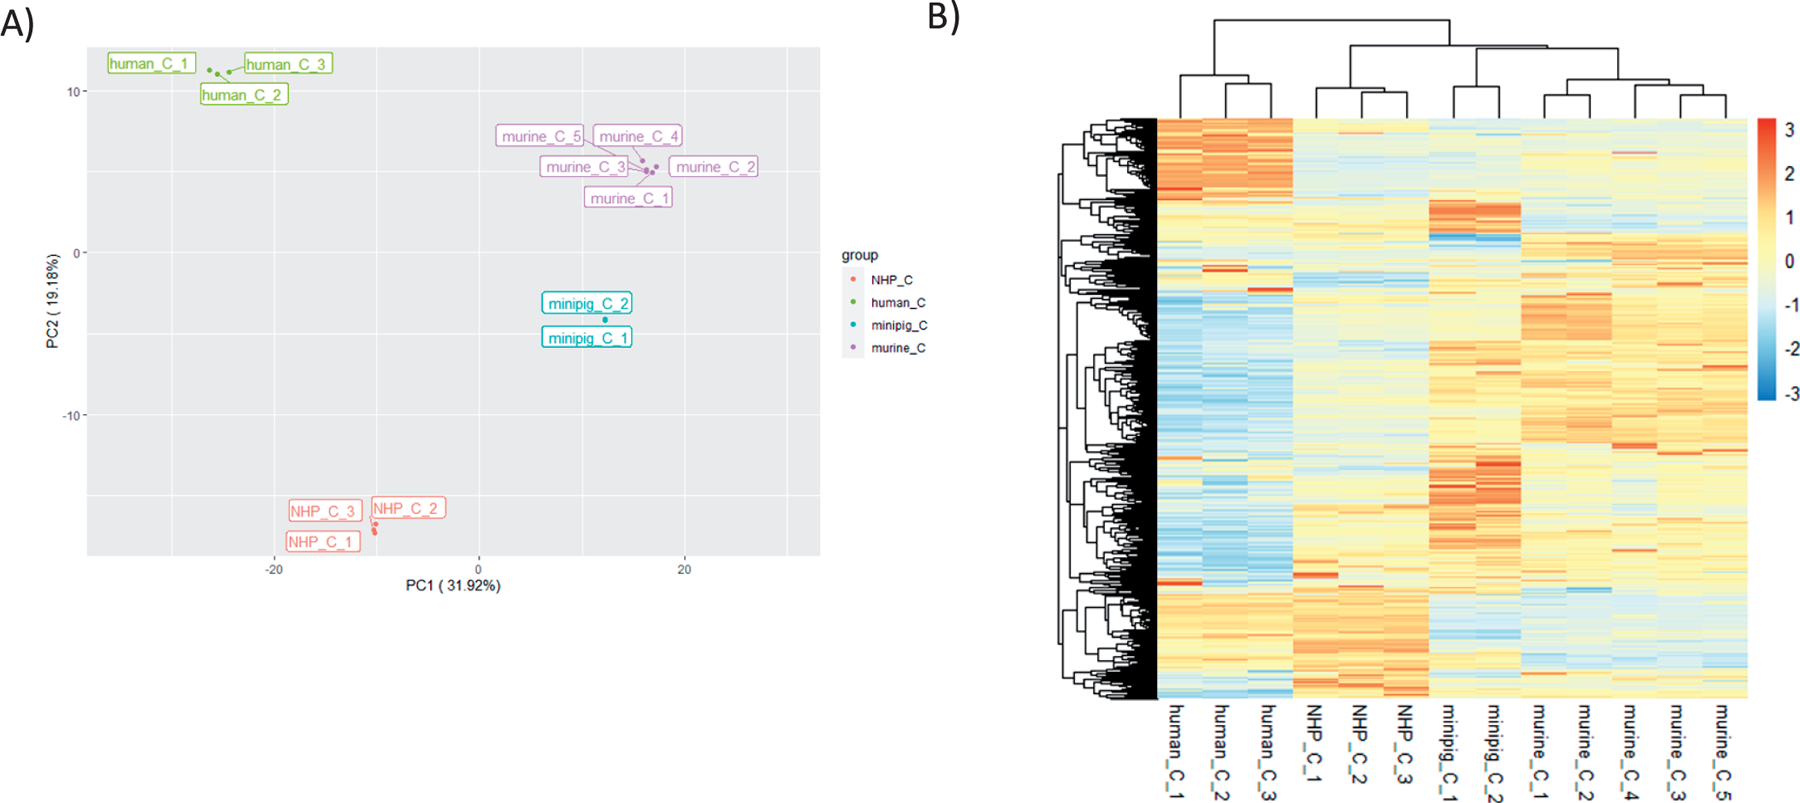
FIG. 1.

Comparison of proteomic expression values for control samples. Panel A: Principal component analysis (PCA) showing relative clustering of control samples for each species: NHP, human, minipig and murine. Samples from each species are color-coded. Axis percentage labels indicate percent variation on principal component axes 1 and 2. Panel B: Heatmap of Relative Fluorescent Unit (RFU) data for each of the respective controls. Red represents upregulation and blue represents downregulation.
