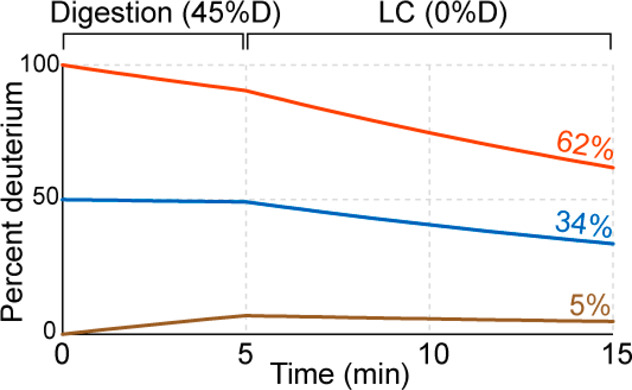
Figure 11.

Deuteration levels are shown throughout a 5 min digestion step and a 10 min LC step for peptides starting with 0% (tan), 50% (blue), and 100% (red) deuterium labeling. Final values recorded by the experiments are shown to the far right with the same coloring. Rates were estimated from Bai et al.48
