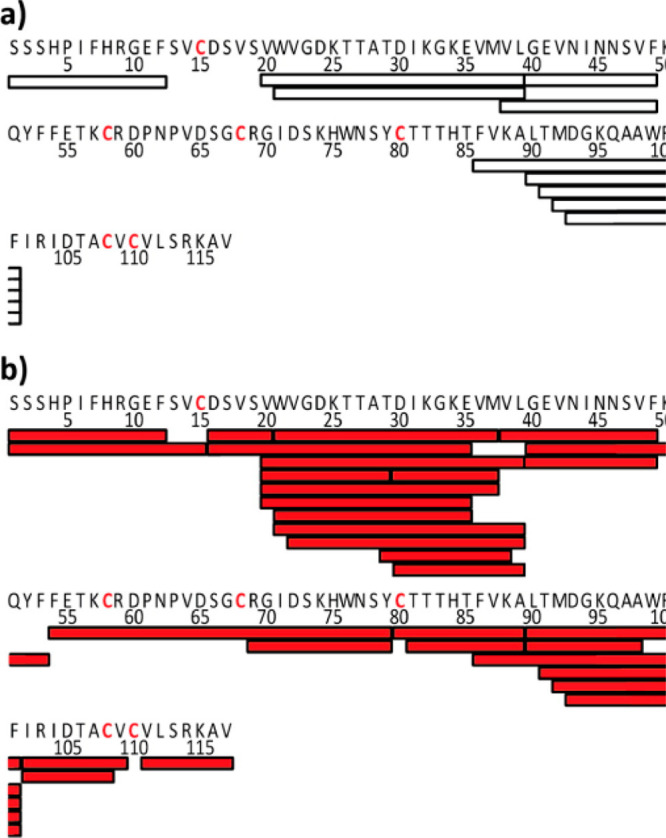
Figure 15.

Peptic coverage maps are shown for nerve grown factor β using either (a) TCEP for reduction or (b) electrochemical reduction prior to pepsin digestion. Bars under the primary sequence show each unique peptide observed. Cysteine residues involved in disulfide bonds are shown in red. Figure adapted from Trabjerg et al.433
