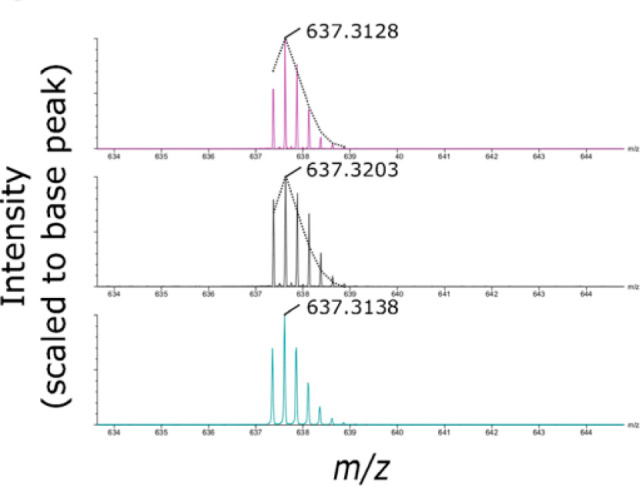
Figure 20.

Detector saturation can lead to distorted isotopic envelopes that offset deuterium measurements. An undeuterated peptide was analyzed by TOF (cyan, bottom), showing the expected isotopic distribution. The same peptide analyzed using an additional ion mobilty separation leads to detector saturation distorting the isotopic profile (gray, middle). The dashed lines indicate the expected isotopic profile. Using a dynamic range extension feature to account for the large ion flux largely mitigates the distortions attributed to detector saturation (magenta, top). Reproduced with permission from ref (215). Copyright 2017 American Chemical Society.
