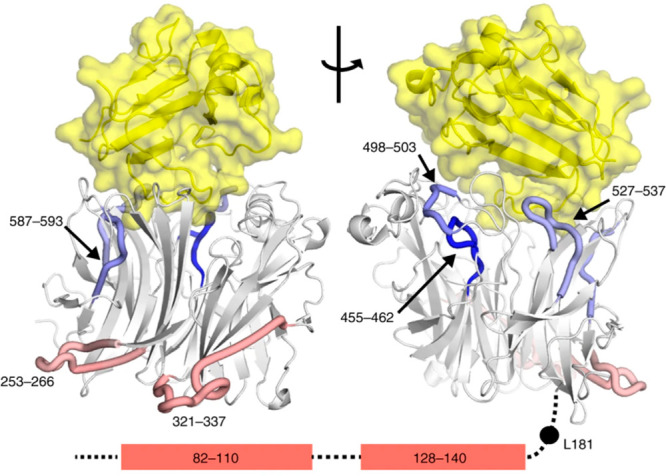
Figure 30.

Allosteric changes observed in the Nipah virus G ectodomain upon binding ephrinB2. Regions of the G ectodomain that do not change (white) become more protected (blue) or less protected (red) are indicated on the structure. The N-terminal stalk helices that also become less protected are shown in the bottom with their predicted positions. The position of EprhinB2 is shown in yellow. Figure adapted from ref (300).
