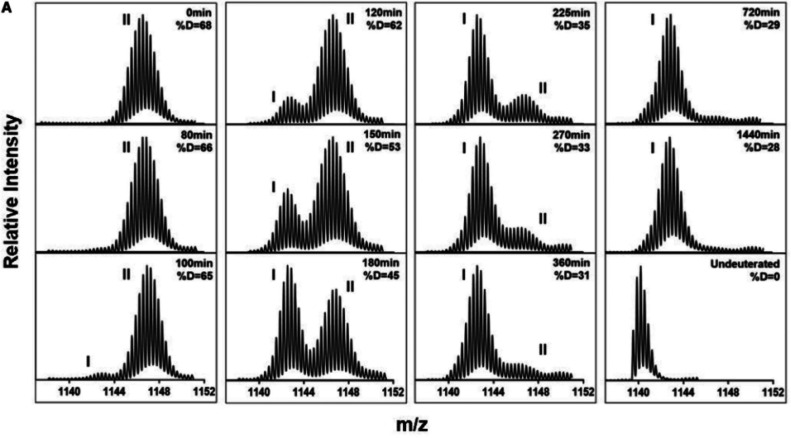
Figure 33.
Pulse labeling HDX-MS used to track the aggregation of calcitonin. Each spectrum shows the deuteration profile (after a 2 min pulse of D2O) starting from initial conditions (0 min) to the final time point at 1440 min. Populations I and II are clearly resolved and shift as the aggregates form over time. Reproduced with permission from ref (394). Copyright 2021 Elsevier.

