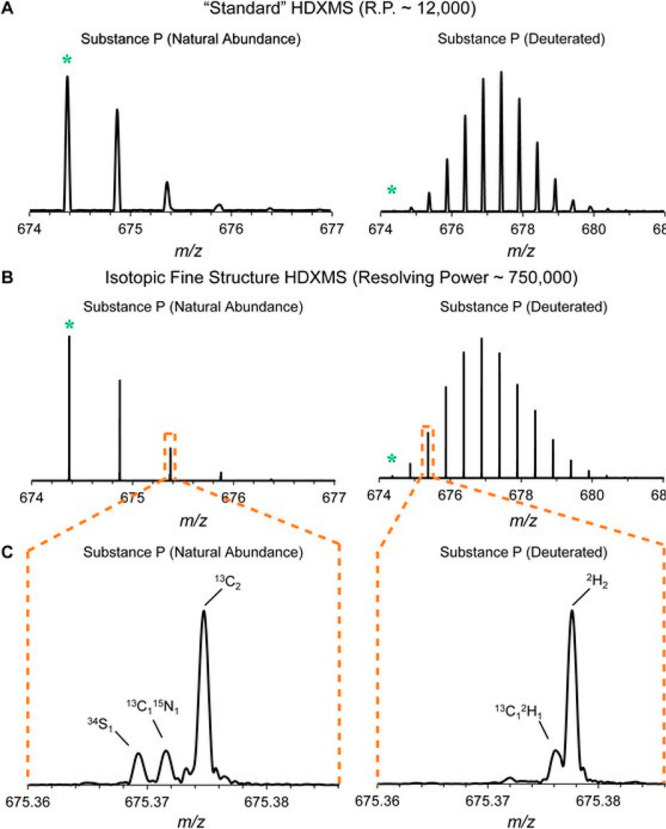
Figure 48.

Spectra are shown for an undeuterated (left) and deuterium labeled (right) peptide at either a mass resolution of 12 000 (a) or 750 000 (b). At ultrahigh resolution, the isotopomers within each apparent isotopic peak become resolved (c). Figure adapted from ref (655).
