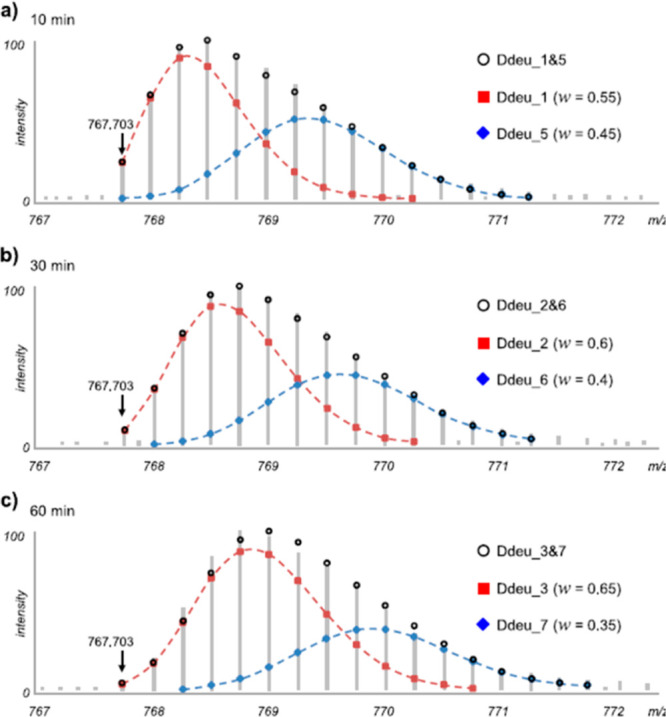
Figure 49.

Deconvolution of multiple isotopic distributions using deMix. Isotopic distributions for three deuterium exchange time points are shown. The distributions could not be fit to a single distribution and thus were fit using two species (red and blue dashed lines). The w term in the inset shows the relative intensities of each species used in the fits. Figure adapted from ref (41).
