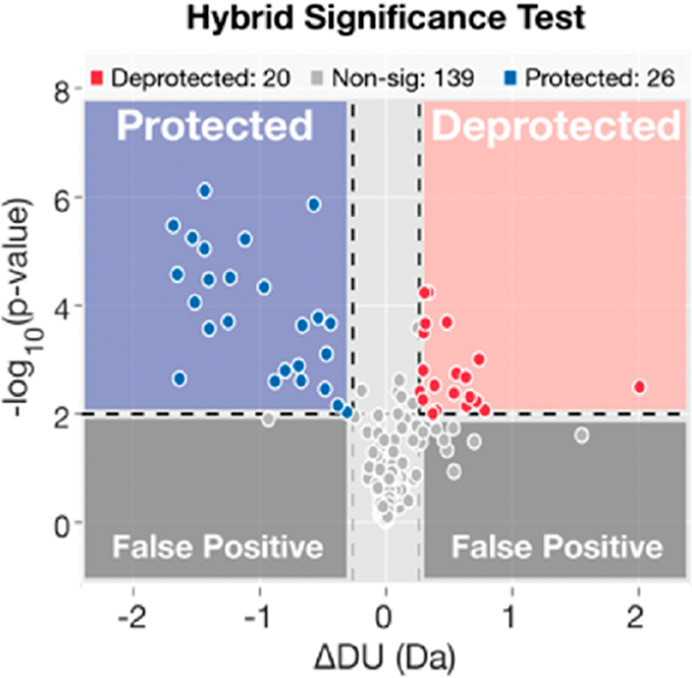
Figure 55.

Examples of a volcano plots generated using Deuteros 2.0. The difference between two states of a protein are shown for all peptides and each time point. The x and y axis show the differences in deuterium uptake (ΔDU) and the p value, respectively. Quadrants that reflect statistically significant differences in exchange are shown in blue and red. Figure adapted from ref (680).
