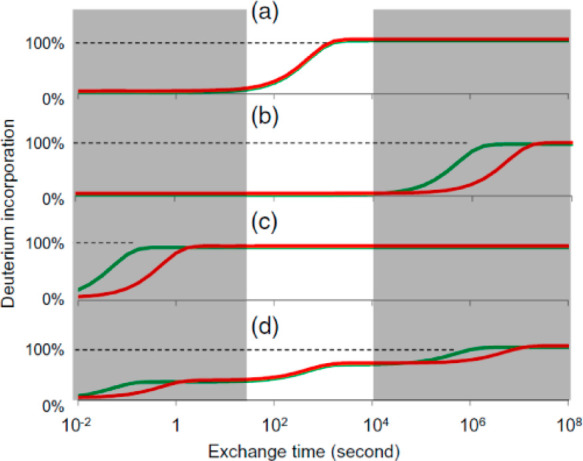
Figure 9.

Amide exchange kinetics in proteins vary over 8 orders of magnitude. Comparative studies that sample only a limited temporal range can lead to missed information. Plots a–d show various kinetics for two states of a protein (red and green). Only in plot a is the comparison truly the same for all exchange times. Plots b–d have actual difference in exchange rates, but they are invisible due to the limited temporal sampling (highlighted region of the plot). Reproduced with permission from ref (24). Copyright 2017 American Chemical Society.
