
Figure 1.
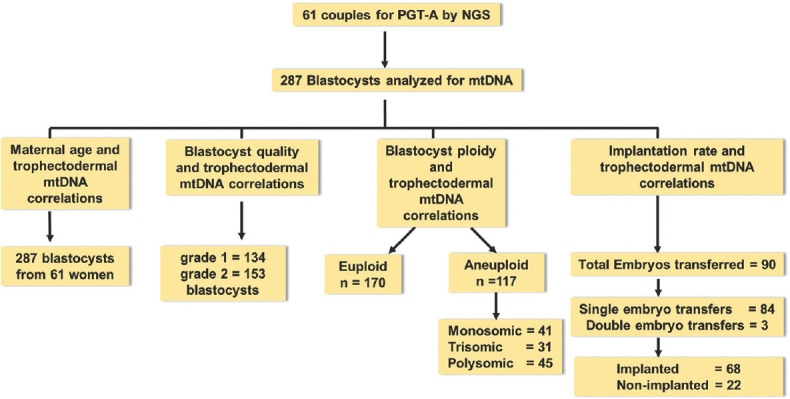
Flowchart depicting the numbers of embryos used to analyse the correlation between mtDNA levels in trophectoderm cells of the blastocyst and other parameters
Official websites use .gov
A
.gov website belongs to an official
government organization in the United States.
Secure .gov websites use HTTPS
A lock (
) or https:// means you've safely
connected to the .gov website. Share sensitive
information only on official, secure websites.
Flowchart depicting the numbers of embryos used to analyse the correlation between mtDNA levels in trophectoderm cells of the blastocyst and other parameters