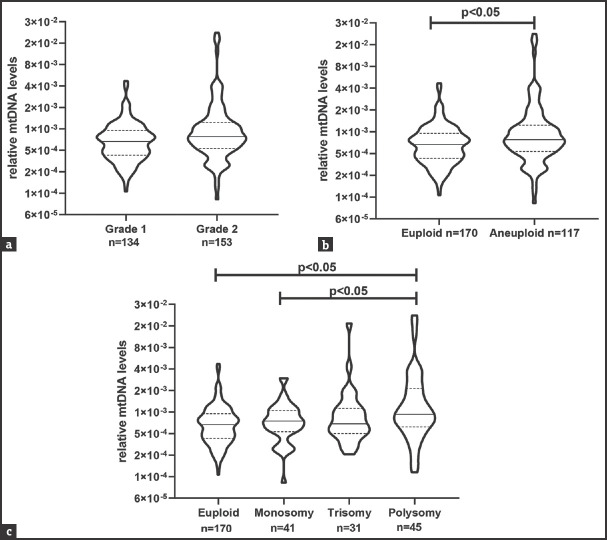
Figure 3.
Association of levels of mtDNA in trophectodermal cells with blastocyst morphology and ploidy status. (a) Comparison of mtDNA levels in grade 1 and grade 2 blastocysts. (b) Comparison of mtDNA levels in euploid and aneuploid blastocysts. (c) Comparison of mtDNA levels in euploid, monosomic, trisomic and polysomic blastocyst. In all the graphs, the value on the Y-axis is relative mtDNA levels. In each violin, the solid horizontal bar is median and the dotted bars quartiles. The numbers (n) of blastocysts are given in each case. P < 0.05 was accepted as statistically significant. mtDNA: Mitochondrial DNA

