. 2020 May 12;10(31):18062–18072. doi: 10.1039/d0ra01645d

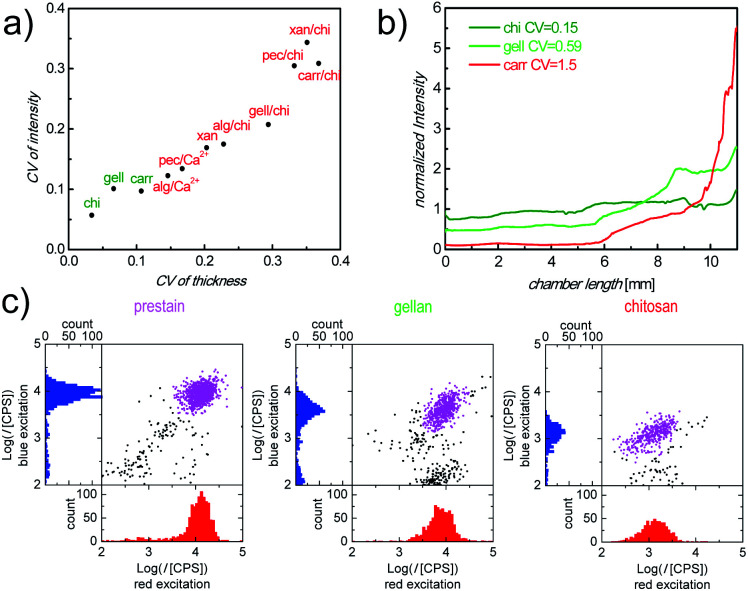
Fig. 2. (a) Correlation of CV of roughness and CV of fluorescence intensity (APC-αCD3 readout) in polysaccharide/Ab layers. (b) Normalized and background corrected intensity ratios, along inflow direction, indicating the distribution of APC-αCD3 in the counting chambers with different cast layers after/before sample inflow. (c) Representative scatter plots and histograms obtained using our image cytometry method. Plotted are the fluorescence intensity (I) of APC-αCD3 (red excitation) and PerCP-αCD4 (blue excitation) stained cells in counting chambers with: prestained cells (left), cells stained in chambers with cast gell/Ab layers (center) and cells stained in chambers with cast chi/Ab layers (right), all after 30 min incubation. Purple dots are cells identified as the double positive cell population.

Fig. 2