. 2020 May 14;10(31):18502–18511. doi: 10.1039/d0ra02964e

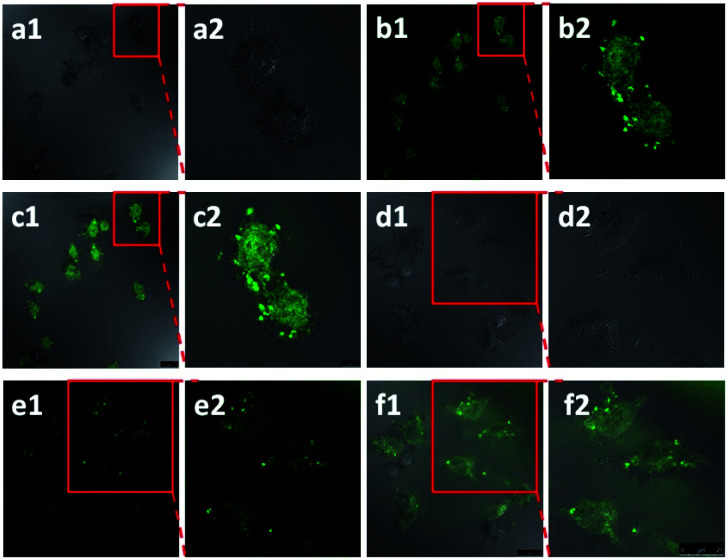
Fig. 4. Confocal laser scanning microscope (CLSM) images of HeLa cells after treatment with the X2-GO Y1 inclusions for 24 h in (a1) bright field, (b1) green field and (c1) merged image of (a1) and (b1); the enlarged area as shown in (a2) bright field, (b2) green field and (c2) merged image of (a2) and (b2). CLSM images of HeLa cells after being treated with X3-GO Y1 inclusions for 24 h as the control experiment in (d1) bright field, (e1) green field and (f1) merged image of (d1) and (e1); the enlarged area as shown in (d2) bright field, (e2) green field and (f2) merged image of (d2) and (e2). Reproduced from ref. 20 with permission from Wiley-VCH GmbH & Co., Copyright 2014.

Fig. 4