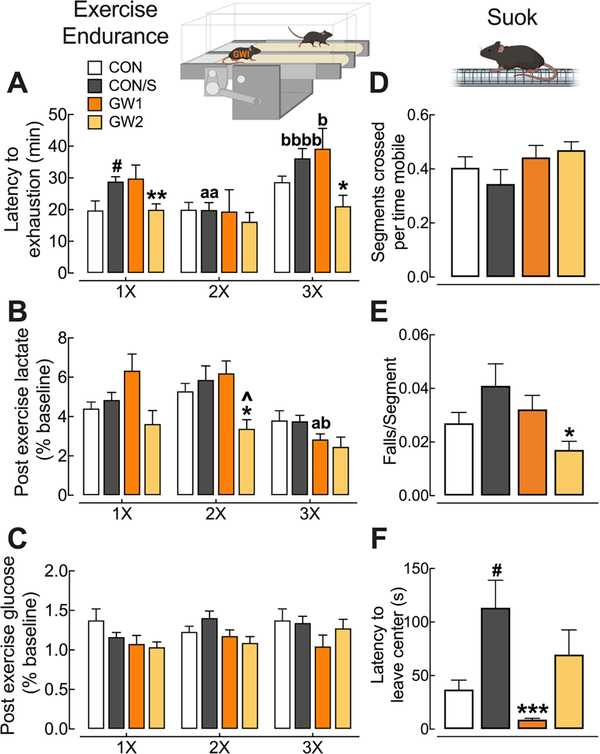
Fig. 3.
GW2 produces persistent exercise intolerance without deficits in locomotion or sensorimotor processing. Mice were subjected to repeat tests of exercise endurance at PT 23 (1×), PT 109 (2×), and PT 161 (3×) and SUOK test at PT 10. Exercise endurance (A–C): (A) Mean scores on latency to exhaustion were significantly reduced for GW2 at 1× and 3× vs CON/S. (B,C) Corresponding mean post-exercise blood lactate (B) were not elevated in any group and post-exercise glucose levels (C) were not significantly affected by exercise. SUOK test (D–F): (D) Locomotor activity, expressed as segments crossed over time spent mobile at PT 10 showed no intergroup differences. (E) Corresponding falls per segment crossed and (F) latency to leave center indicate no sensorimotor deficits for GW groups. Values are expressed as mean ± s.e.m. aSignificantly different from x1, ap < .05, aap < 0.01. bSignificantly different from x2, bp < 0.05, bbbbp < 0.0001. *Significantly different from CON/S at corresponding time point, *p < .05, **p < .01, ***p < .001. Ŝignificantly different from GW1 at corresponding time point, ^p < .05. #Significantly different from CON at corresponding time point, #p < .05, n = 5–10/group (A-C) and n = 12–15/group (D-F). GW1, 6.5 mg/kg b.i.d.; GW2, 8.7 mg/kg.

